Your go-to, cost-effective hub for edtech insights and self-guided decisions
Book Your Portal Demo Today!Global, comprehensive data since 2014
With historical insights and up-to-date trends across thousands of institutions, you’re empowered to make well-informed strategic decisions based on real-world data.
Higher education institutions
K-12 schools and school districts
Endless high-quality data
for all your needs
Our database is structured to help you meet your business goals. We include many sources (IPEDS, NCES and international references) in our dataset to ensure we cover our client requirements.

All-in-one analysis for education technology
Monitor Strategic Market Dynamics
Discover Emerging Technologies
Benchmark Yourself Against Peers
Optimize Tech Stack Compatibility
Maximize Investment Efficiency

Trusted, unbiased data from industry experts
We’ve been collecting and analyzing education technology data for over 10 years, and we continue to collect hundreds of data lines every day. We’re the only ones who collect this data, but we don’t take that fact for granted. We’re a neutral third party – just the facts, ma’am, as they say.

Take a deeper dive with our in-depth analysis
Each month, we offer trend analyses and case studies curated for you by the expert data scientists at ListEdTech.
Stay in the know…
Blog & News
Student Privacy at Risk? EdTech Surveillance in Focus
As classrooms digitize, the promise of EdTech meets mounting concern over an unintended byproduct: student surveillance. Over the last two months, privacy advocates, educators, and policymakers have sounded alarms about how these tools collect, analyze, and retain student data—often with insufficient oversight. Surveillance in the Classroom: Fresh Examples GoGuardian & Gaggle Edtech surveillance tools like GoGuardian ... Student Privacy at Risk? EdTech Surveillance in Focus Read More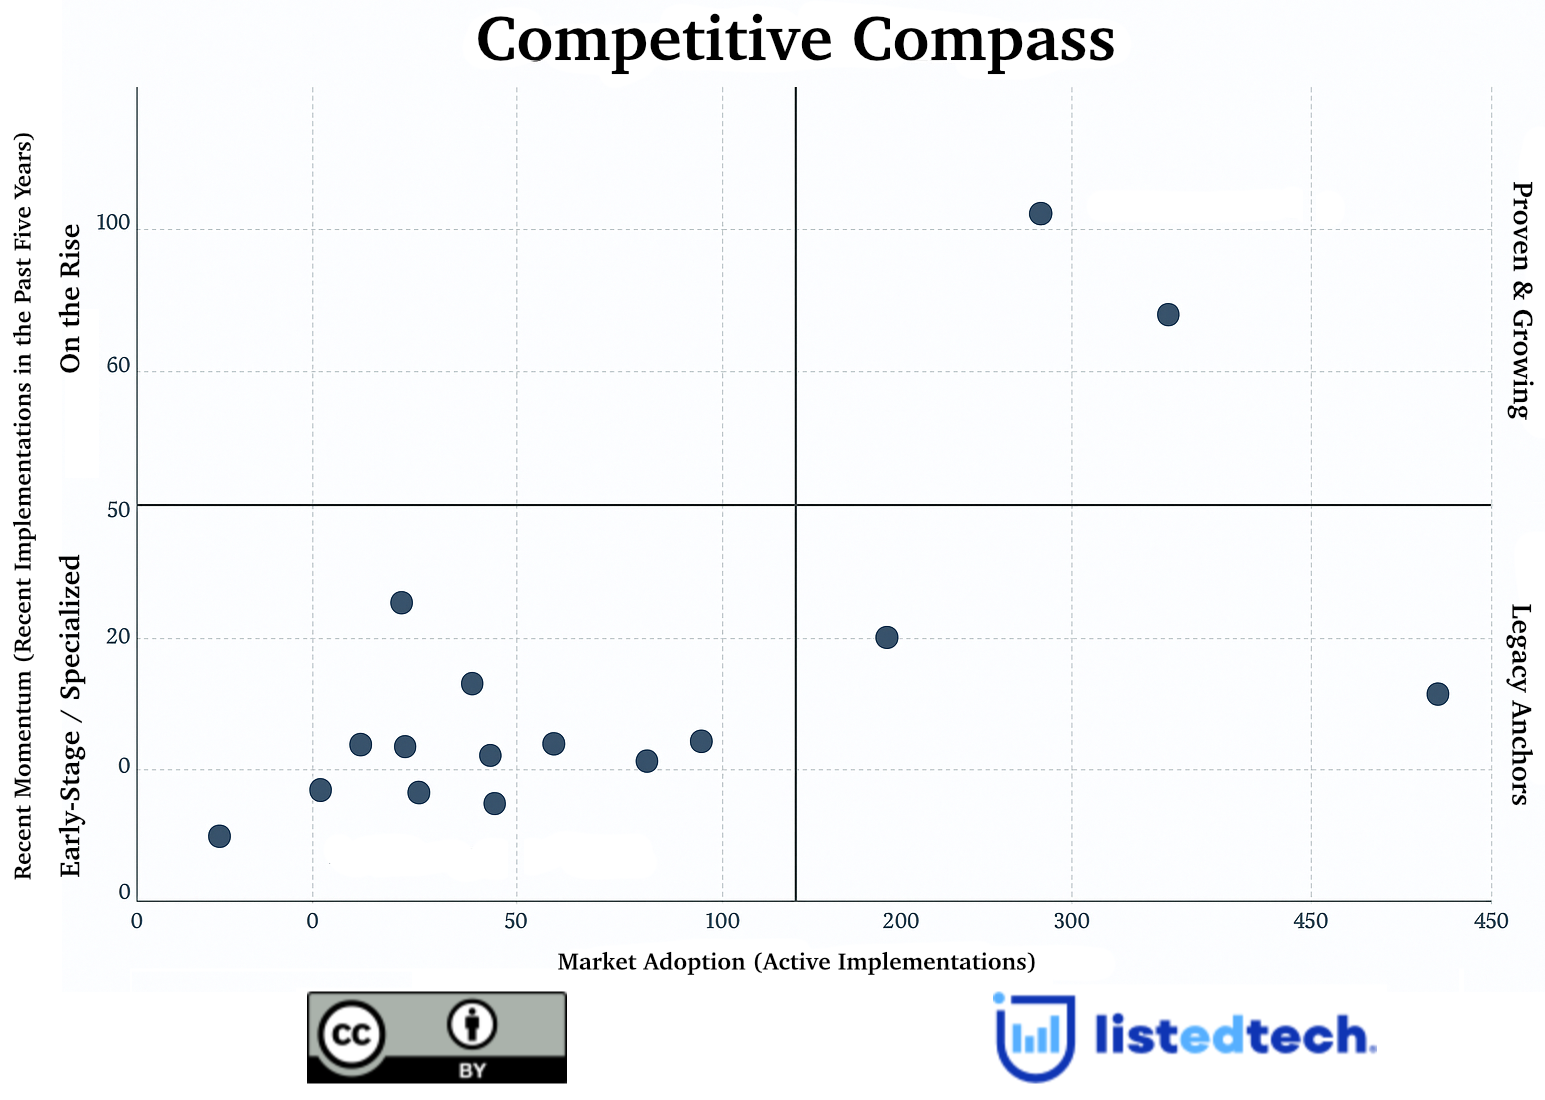
Introducing the Competitive Compass: A Smarter Way to Read the EdTech Market
Understanding education technology markets isn’t just about who’s “winning.”It’s about who is best — for whom, and why. At ListEdTech, we believe that context matters. Comparing two products without understanding their target users is misleading. One product may dominate large research institutions in North America; another might be the go-to choice for small vocational colleges in ... Introducing the Competitive Compass: A Smarter Way to Read the EdTech Market Read More