How much time a system is kept before it’s due to be replaced? What is the average lifespan of IT systems in a said product category? Is it time for our institution to change its systems? How many systems does an institution change per year? You guessed it, this post will talk about implementation numbers and the average lifespan of products.
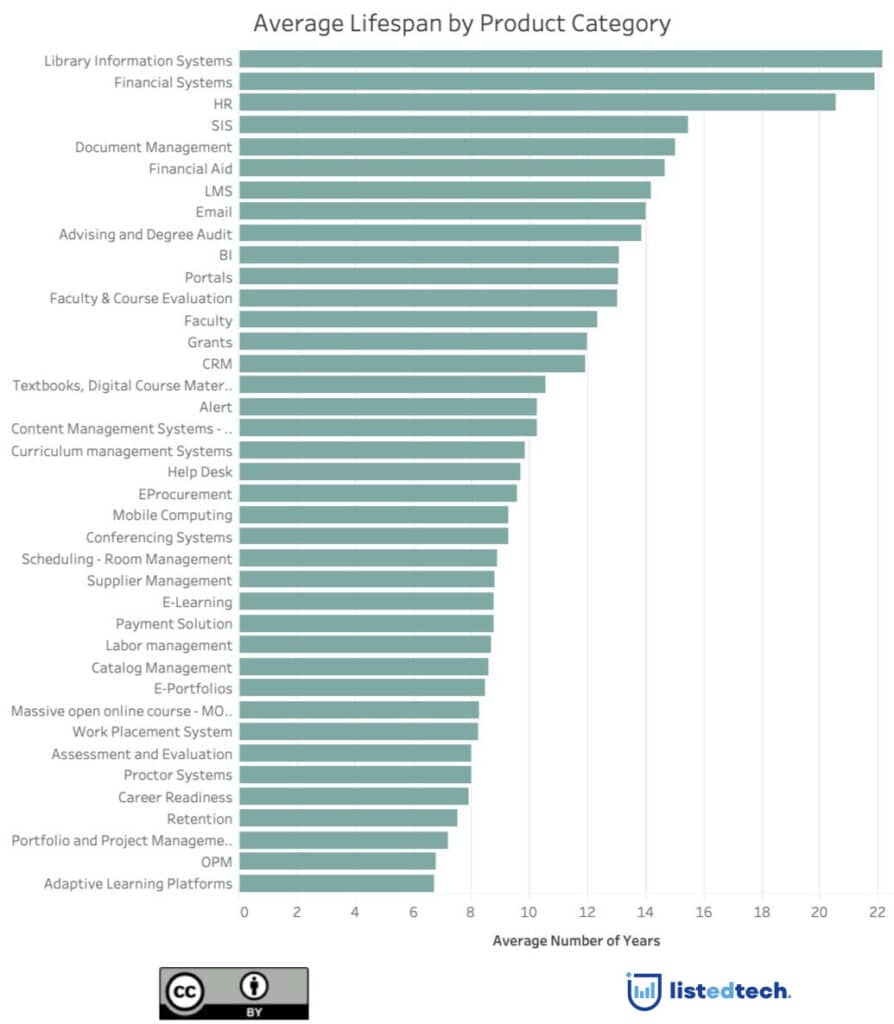
When we look at the product categories and the average lifespan, we can better interpret the data by creating groups:
administration of an institution,
teaching and support to teaching,
student life and career
evolution of the business.
While the first three groups are self-explanatory, the evolution of the business group can be defined as systems that didn’t exist 10-20 years ago and that offer a service in an online form that existed previously in another form. In this group, we can put OPM, Proctor Systems, E-Portfolios, Payment Solutions, Catalog Management, MOOCs, OPM, etc.

When we look at the first graph, we can see that most systems that have the longest lifespan are in the administration group (Financial Systems – almost 22 years, HR – more than 20 years, SIS – almost 16 years, Document Management – around 15 years). On the other end of the spectrum, several systems in the student life and career as well as the evolution of the business are below the 10-year mark: EProcurement, Conferencing Systems, Scheduling – Room Management, E-Learning, Payment Solutions, E-Portfolios, MOOCs, Proctor Systems, Career Readiness, Retention, etc.
The Impact of Commercial Solutions in the System Decommissions
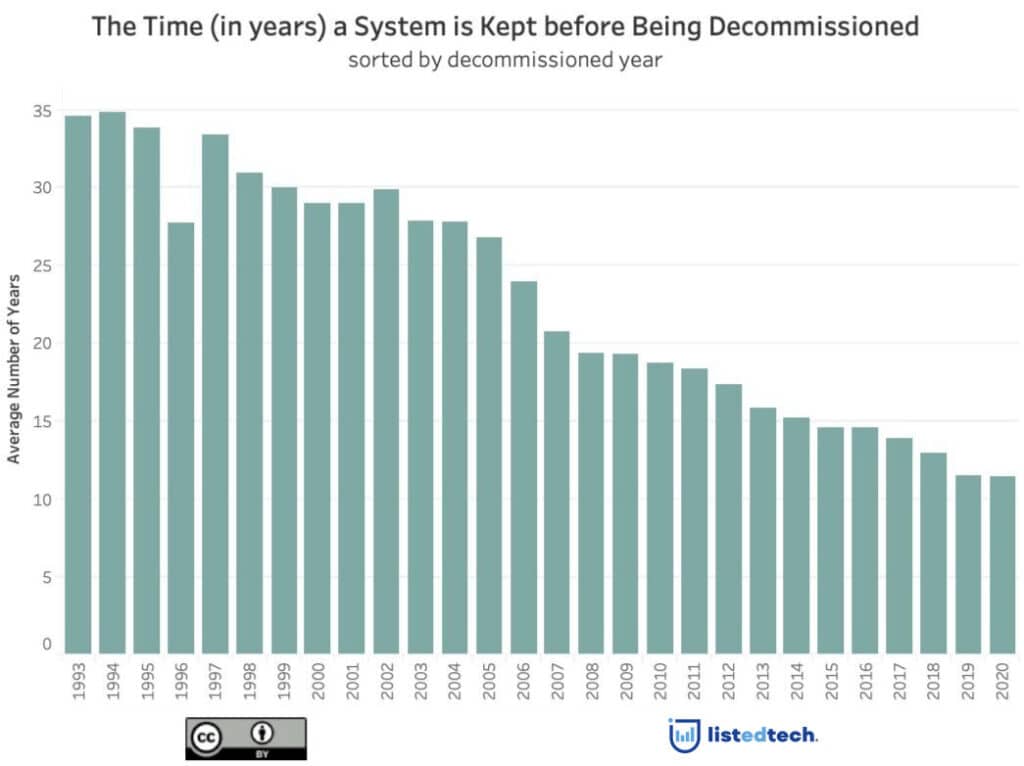
Our “Time a System is Kept” graph shows a trend since 1993. In fact, we can see the product lifespan is getting shorter and shorter over time. We believe that this trend is due to more commercial solutions being available and implemented while homegrown systems are abandoned. It’s easier for institutions to adopt non-homegrown solutions for maintenance, upgrade and support reasons, especially if they are offered by vendors as SaaS. Once they have abandoned their homegrown system, institutions will, most likely, not keep the commercial solution as long as they kept their homegrown system; they will switch to another solution as soon as the current system no longer meets their business requirements.
Over the years, we saw new product categories emerged. This could also explain why implementations have had a shorter lifespan.
Number of IT Systems Replaced Each Year in Institutions
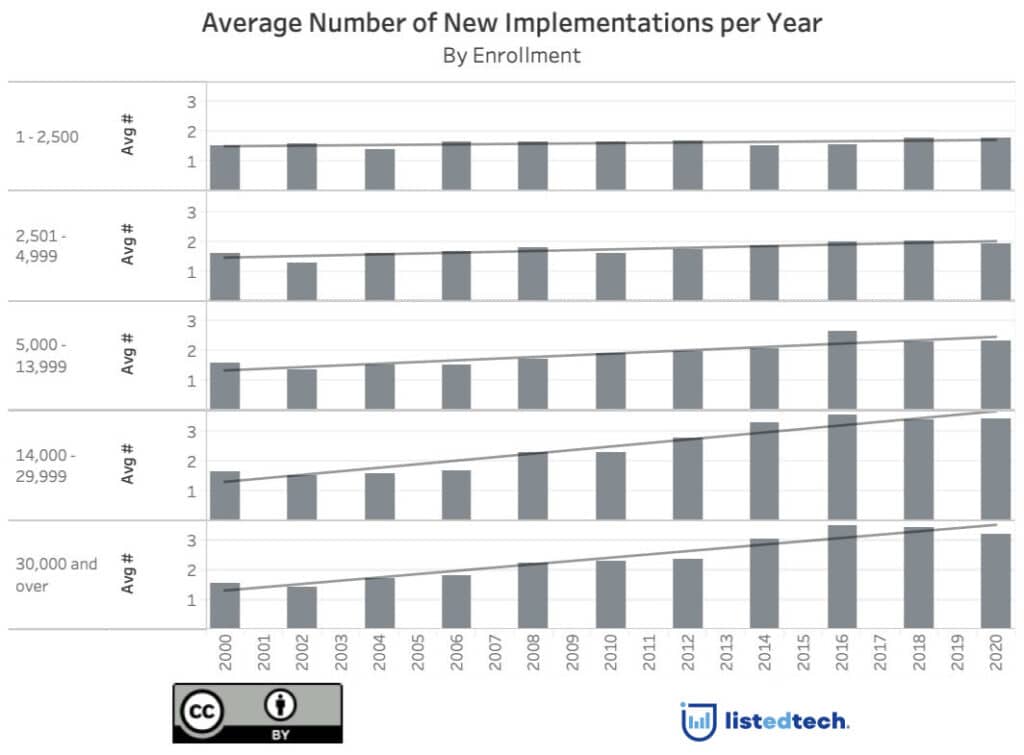
Another question that we may ask is: how many systems are replaced each year within an institution? The table below shows the numbers of systems that changed per year (defined as new implementations; upgrades of current systems were excluded) regardless of their product categories. We note that institutions with bigger enrolment tend to implement more new systems in a year than smaller institutions.
When looking at the data, we see an acceleration of new implementations in the past 20 years. This is more visible in the institutions with an enrollment of over 5000. A few of the reasons that can explain this trend is that institutions have access to more options. It’s easier to migrate from one system to another and we believe students have higher expectations.