
Many instructional leaders benchmark their institutions against others, intending to understand how to reduce expenditures and enhance productivity. Leveraging tools such as Educause’s Core Data Service, these leaders examine how their finances, staffing, and services compare against similar institutions and understand their level of maturity to launch strategic initiatives (analytics, etc.).
This approach to benchmarking is undoubtedly helpful, as it provides insight into institutional IT services and empowers conversations with non-IT leaders about the value technology brings to institutional departments and the entire institution. Yet, if higher education aims to ensure student success, should we recalibrate benchmarking to include student outcomes?
Methodology
We analyzed our implementation data for about 2,663 four-year US higher education institutions to answer the question. We then added IPEDS data for the percentage of full-time first-time students receiving an award within six years. Likewise, we normalized all data on a zero-to-one scale for easier comparison. Finally, we performed K-means clustering, a machine learning that unearths homogeneous subgroups within the data.
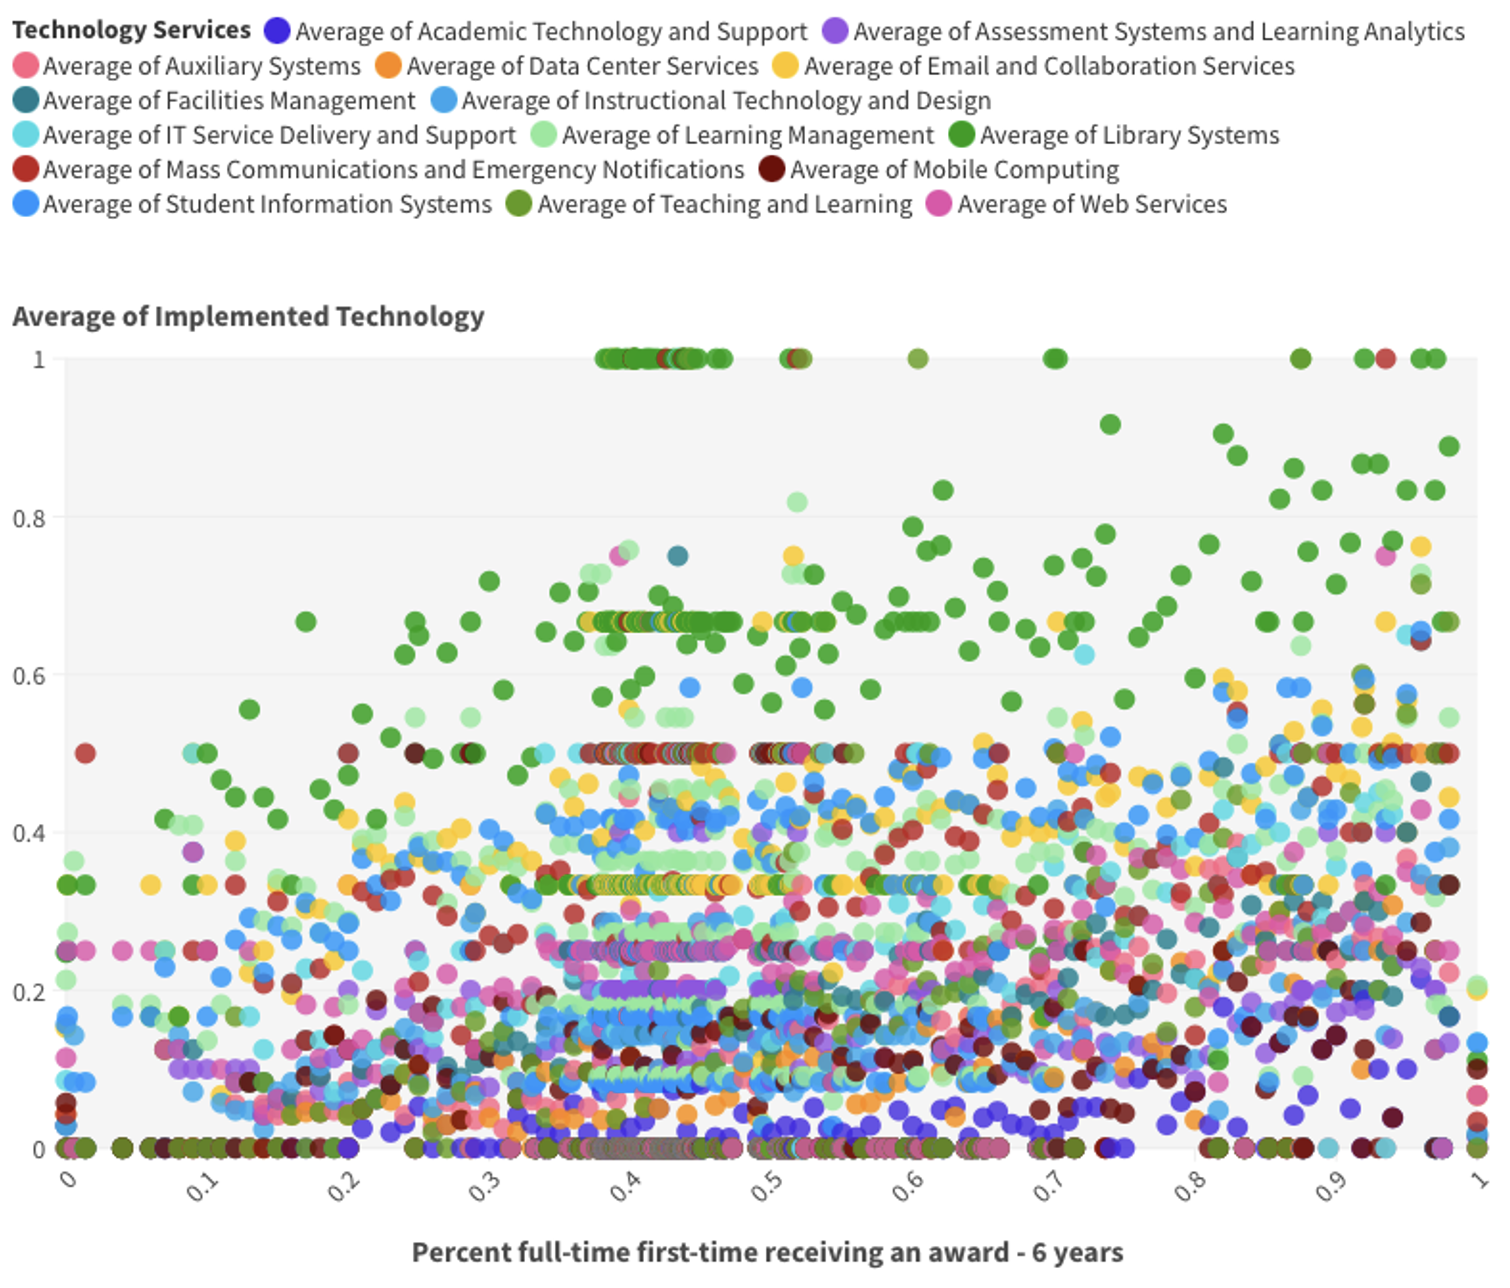
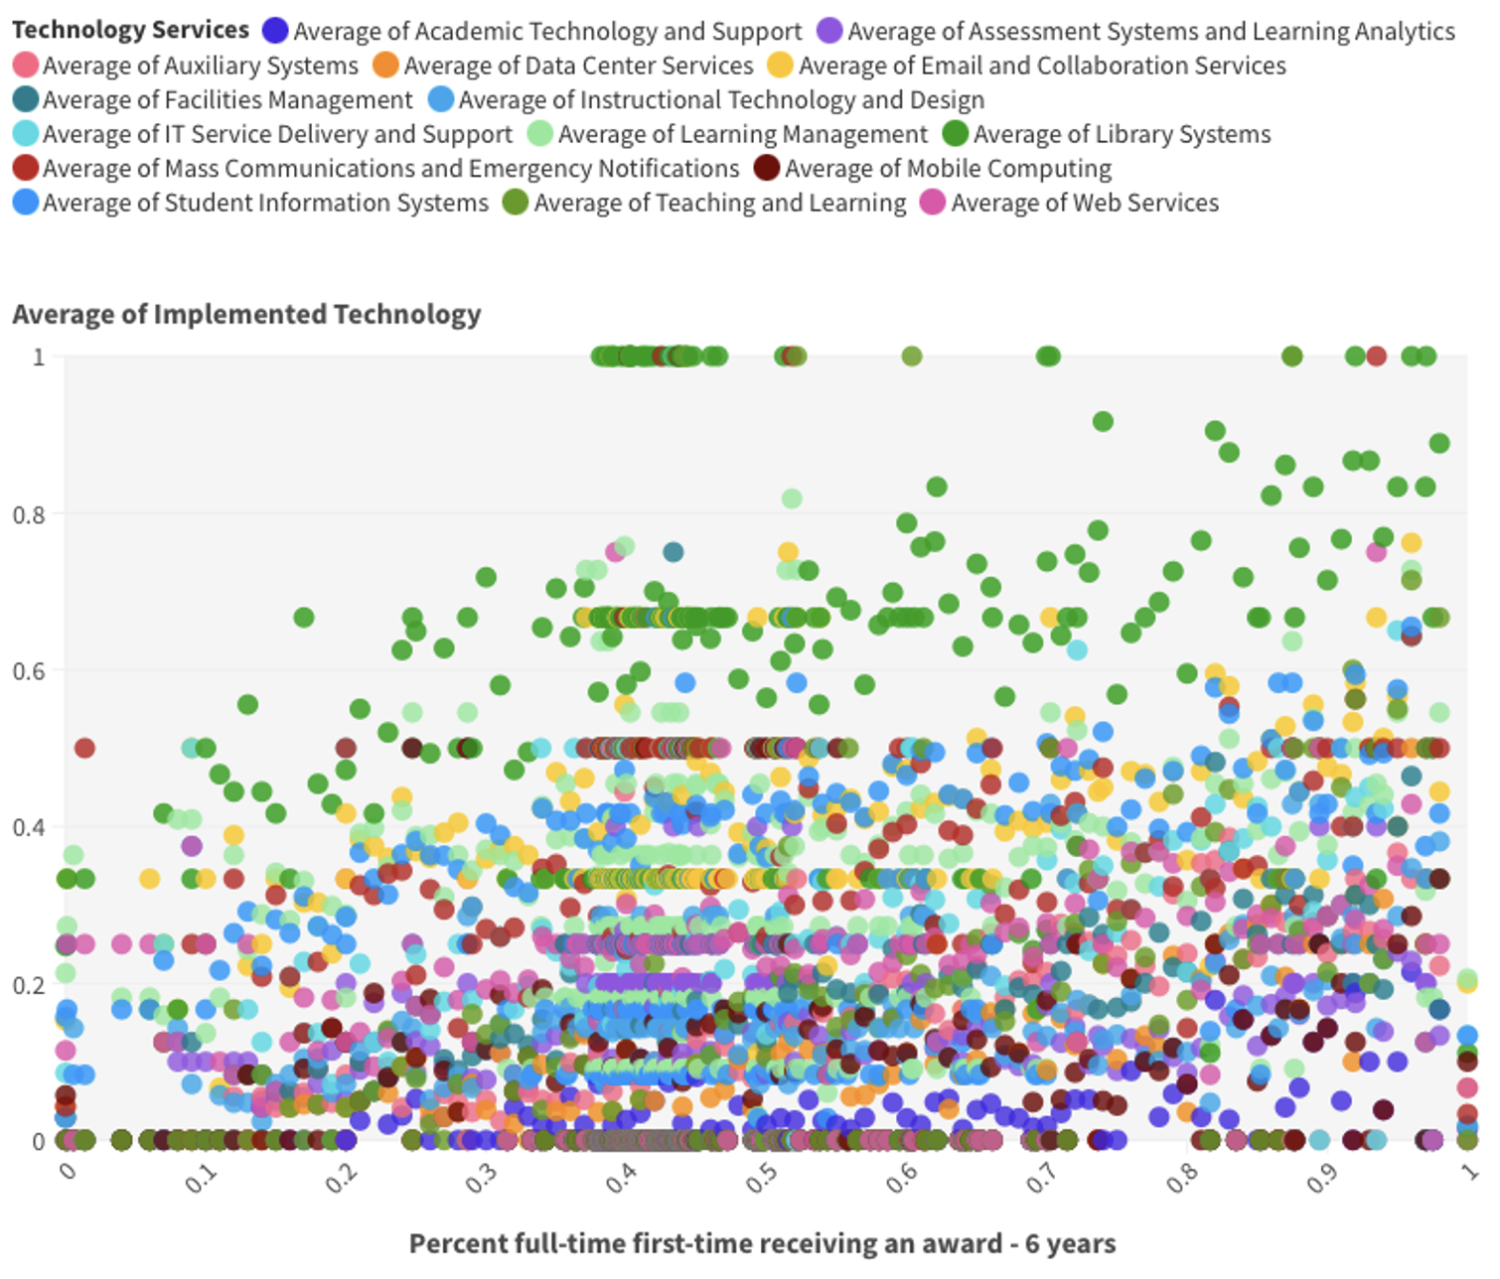
Why is this approach critical? Figure 1 below indicates some relationships between the average of implemented technology at institutions and the percentage of full-time first-time students receiving an award within six years. For example, the average implementations of solutions within the Library Systems category (in green) appear to have a close correlation with a high percentage of the overall full-time first-time students receiving an award within six years, while the average implementations of solutions in the Email and Collaboration Services category (in yellow) seem to appear equally in institutions with low, medium, and high percentage of full-time first-time students receiving an award within six years.
Yet the figure also shows how little we can say about anything else. Can we, for example, be sure of what the figure suggests about the relationships between systems within Library Systems or Email and Collaboration Systems and the six-year graduation rate for full-time, first-time students? Likewise, can we tease out the relationships between other categories and the six-year graduation rate for full-time, first-time students?
Findings
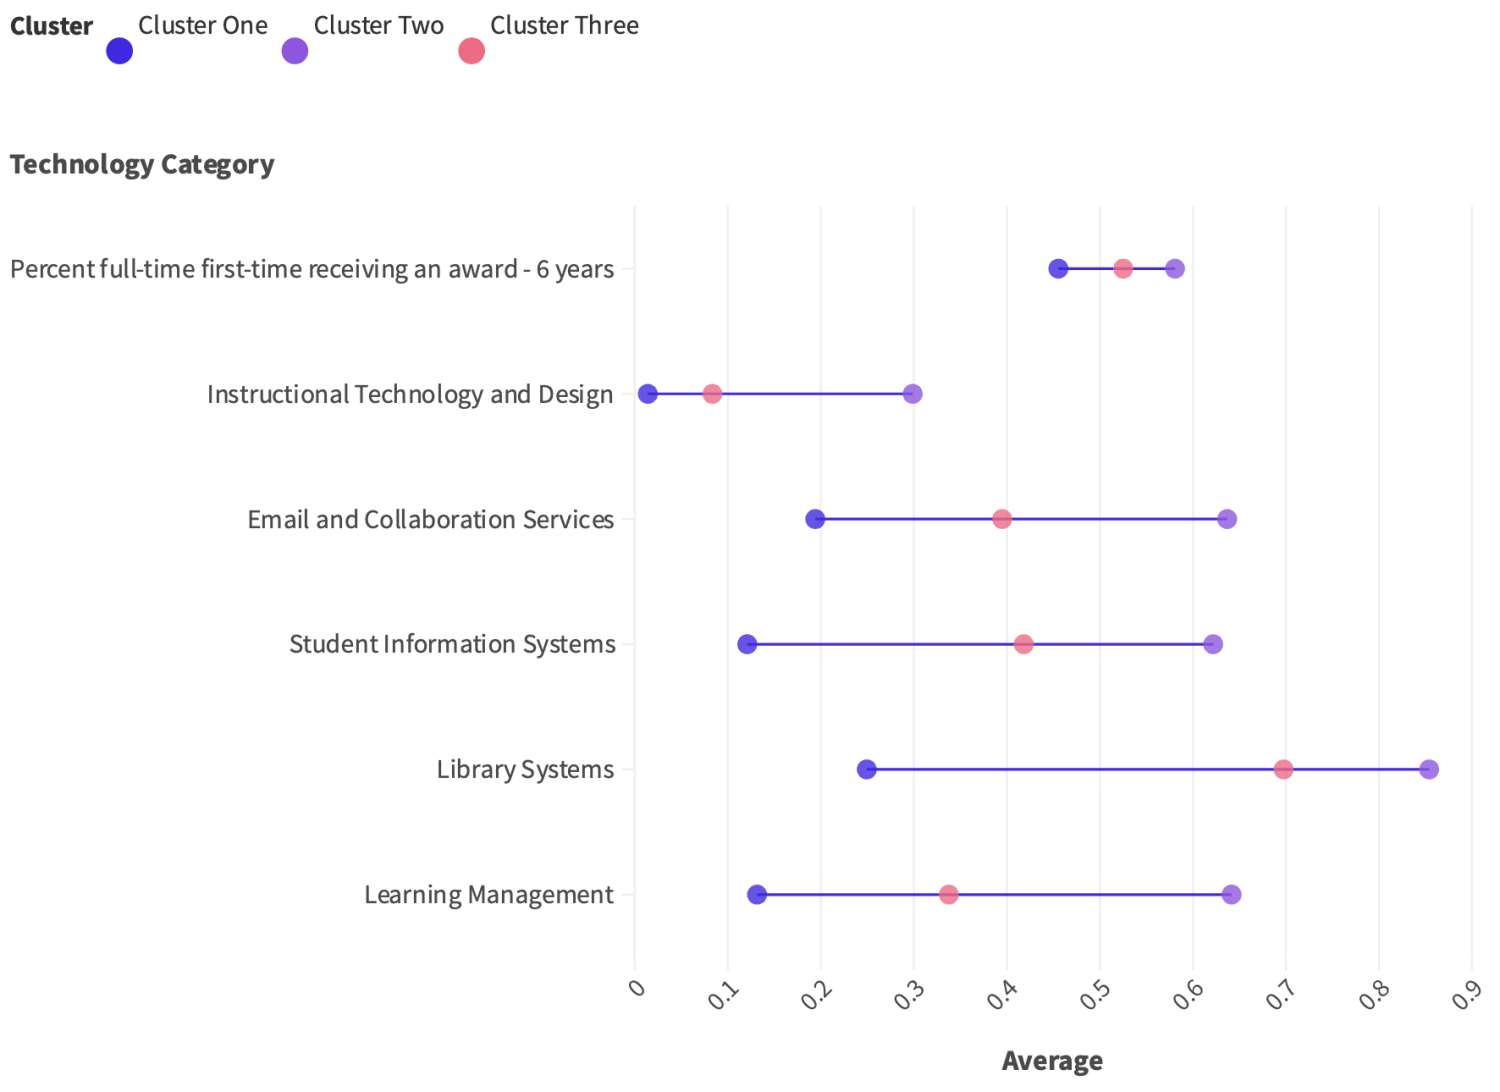
The output of our analysis revealed three clusters, as shown in Figure 2. These clusters are distinguished by three levels of average six-year graduation rate for full-time, first-time students (high, medium, and low) and five technology categories, i.e., instructional technology and design, email and collaboration solutions, student information systems, library systems, and learning management systems:
- Cluster One (Low-Average Graduation Rate): This cluster comprises just over 920 institutions, most of which (five hundred and eighty-five) fall within the private not-for-profit, 4-year or above sector. Institutional leaders in this cluster have the lowest average implementations of technologies in each essential category.
- Cluster Two (Highest-Average Graduation Rate): This cluster comprises the smallest number of institutions (648), most of which (four-hundred and sixty-five) fall within the public, 4-year, or above sector. Institutions in this sector have implemented more technology solutions in the critical categories than any other cluster.
- Cluster Three (Medium-Average Graduation Rate): This cluster comprises the most significant number of institutions (1093), most of which (four-hundred and sixty-five) fall within the private not-for-profit, 4-year or above sector. Institutions in this sector have implemented more technology solutions in the critical categories than the first cluster but less than the second.
Why do these findings matter? First, it helps identify which technology categories have the closest relationship to a given outcome, which empowers leaders to benchmark these technologies considering outcomes. Also, these findings help leaders explore whether it is simply the case that more technology results in higher outcomes or whether the type or mix of technologies is critical. In any case, this approach helps us move beyond relying solely on finances, staffing, and services to factoring in whether these technologies help us achieve one of the pillars of higher education institutions, i.e., student success.
Summary: Outcomes Should Supplement Existing Analyses
Understanding the institution’s efficiency, productivity, and maturity is crucial for leaders to know how their IT departments operate. Without it, leaders may not know whether they are devoting too many resources to a strategic initiative or are not ready to undertake it.

However, unless we can measure operational efficiency and maturity along with the intended outcomes of institutions, we are only seeing part of the picture. We may be operating efficiently and prepared to take on new initiatives, but we may be struggling or unprepared to support student success.
Therefore, we suggest that institutions continue to use tools like the ones that Educause offers but supplement these with various outcome measures (graduation rates, retention rates, etc.) to get a fuller picture of the value or lack of value IT brings to the institution.