
Key Takeaways:
- Data-driven alternative to reviews: Replaces subjective user reviews and misleading feature checklists with verified, real-world implementation facts.
- Evaluates three core vendor metrics: Compares products side-by-side across client profiles, 24-month implementation momentum, and vendor stability indicators like churn and tenure.
- Eliminates procurement blind spots: Gives buyers an evidence-based view of true market movement, peer adoption, and vendor health before making purchasing decisions.
For years, we have been asked to create a product comparison tool that would let you look at products side-by-side. And for just as long, I have been firmly against the idea.
Why? Because at ListEdTech, we don’t track specific, granular features of a product. If you’ve spent any time in procurement, you know that feature-by-feature checklists are often misleading and quickly outdated.
Then we had clients asking us to add client reviews to our portal. To me, that felt like a dangerous direction to take. Subjective reviews can be easily manipulated, and once you make them part of the equation, there’s a natural pressure to keep generating more and more positive reviews simply to remain competitive. Before long, you can find yourself in a world where companies are incentivizing people to review products they barely know or have barely used.
So, my answer has always been: no.
But over the years, we have developed a deep appreciation for our data. We realized we could build metrics around our implementation data to help our clients understand how to evaluate products based on their actual peers, rather than subjective opinions.
That is why I am incredibly happy to finally show you our brand-new side-by-side comparison tool.
Instead of relying on sponsored rankings or easily-gamed reviews, this tool uses verified, real-world market facts and implementation data to help you back your procurement decisions with hard evidence.
What We Track (and Why)
Our new tool lets you select a product category, like Student Information Systems (SIS), and compare two systems side-by-side. Rather than looking at feature checklists, we look at three critical areas of vendor health and product adoption:
1. Client Profile
Understanding who is actually using a system helps you see if a product is a good fit for your institution:
- Client Composition & Institution Level: We show you the split between Higher Education and K-12, as well as institution-level breakdown (less than 2 years, 2 years, and 4 years).
- Total Active Implementations: How many active installations currently exist for each product.
- Global Adoption Status: This tells you the total number of countries actively running the software.
- System Overlap: The rate of customers simultaneously running an additional system in the same category.
- Average Institution Tenure: How long does an institution actually keep this product before transitioning to another platform?
2. Implementation Statistics
We look at actual market activity over the trailing 24 months to see where a product is gaining or losing momentum:
- Recent Implementations (With & Without Upgrades): We track net-new client deployments onboarded from competitors or manual processes, alongside major intra-suite upgrades.
- Recent Decommissions: We monitor voluntary customer departures or cancellations, specifically excluding institutional mergers or campus closures.
3. Vendor Stability & Market Presence
Selecting a vendor is a long-term partnership, so we provide critical risk indicators to help you assess vendor stability:
- Vendor Churn Rate: The percentage of institutional attrition over the trailing two years.
- Product-to-Product Migration: A net comparative transition index showing whether customers are migrating toward a product (positive score) or leaving for the other product (negative score).
- Client Base Diversity: Whether a vendor relies heavily on statewide frameworks and consortia, or has a highly independent distributed customer footprint.
- Company Recent M&A Activity: Tracking company ownership changes, private equity transitions, or corporate mergers in the last 24 months.
- End-of-Life (EOL) Announcements: Confirmation of any official phase-out, sunsetting, or core maintenance cessation schedules.
See It in Action
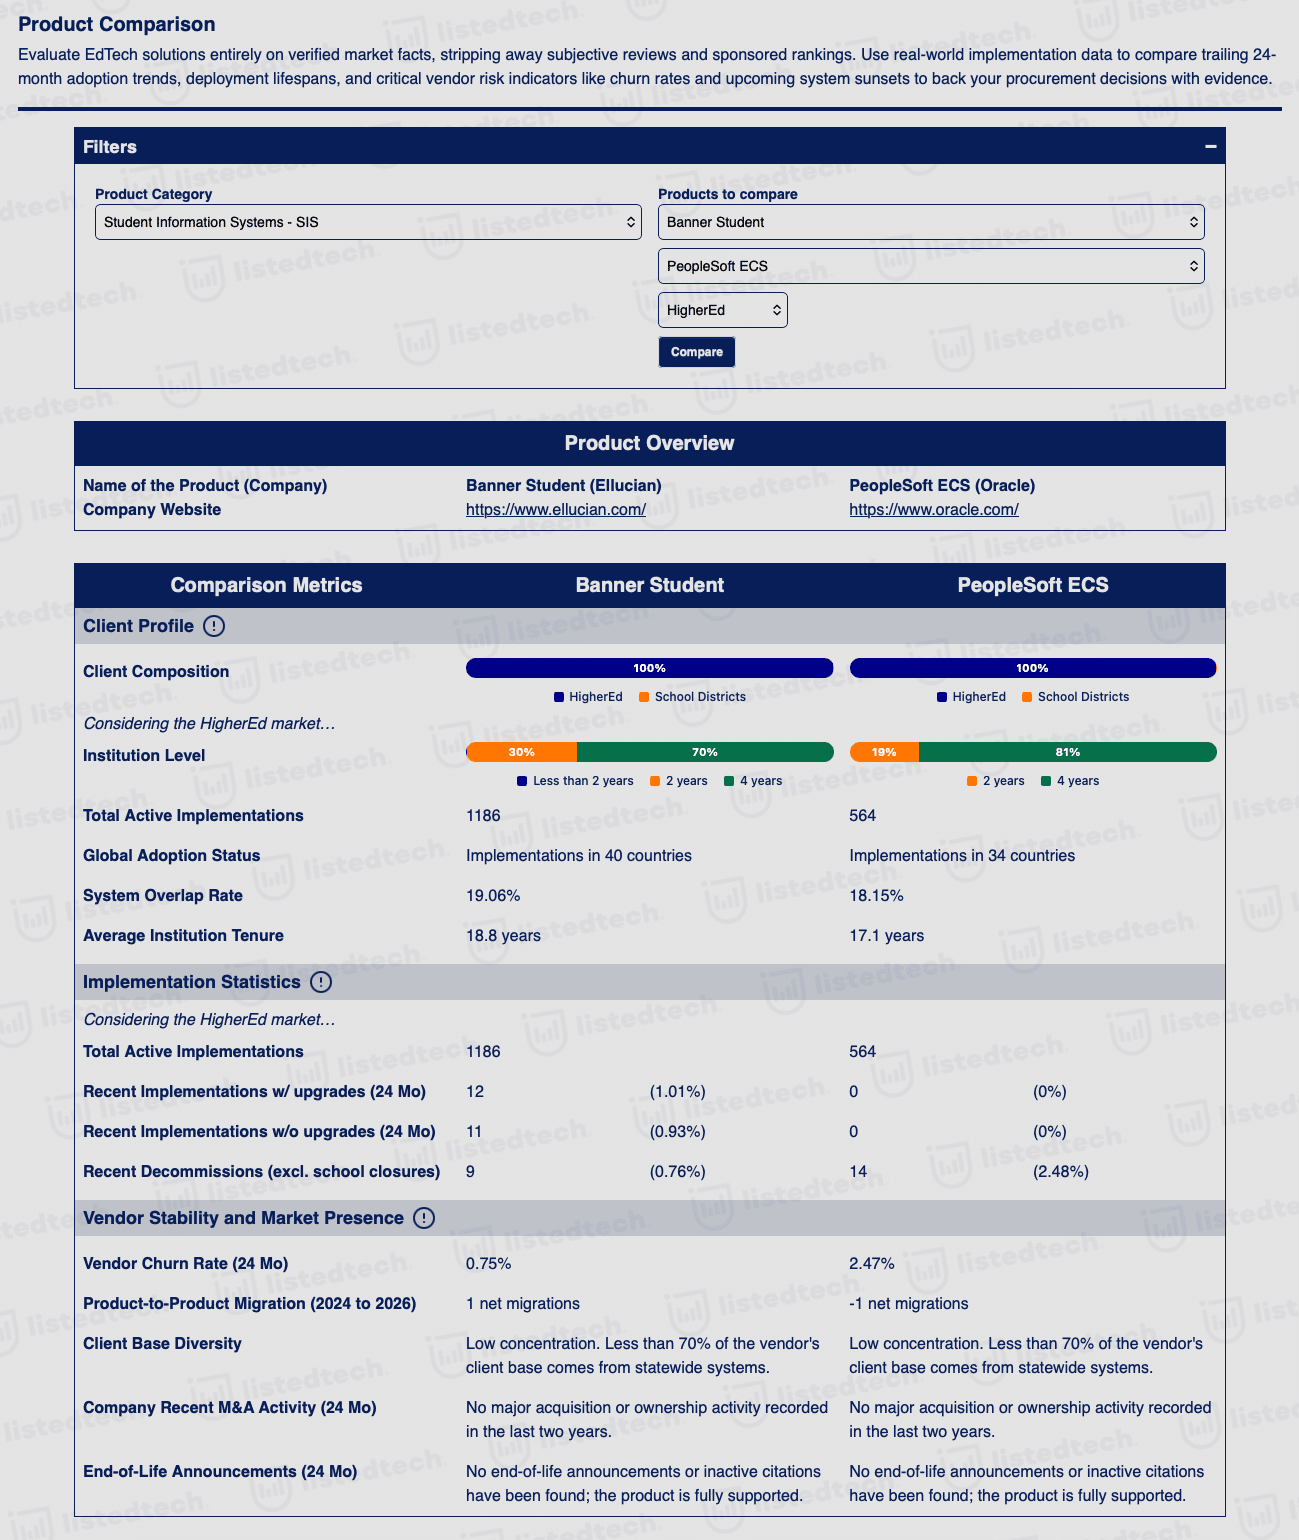
In our new interface, you can select systems like Ellucian’s Banner Student and Oracle’s PeopleSoft ECS and immediately compare their profiles:
- Average Tenure: See how Banner’s average tenure of 18.8 years compares with PeopleSoft’s 17.1 years.
- Active Implementations: Compare their market footprint, with Banner at 1,186 active implementations versus PeopleSoft’s 564.
- Market Momentum (Trailing 24 Months): See where the movement is. For example, Banner had 12 implementations with upgrades, including 11 from new clients, while PeopleSoft saw 0 in both categories and experienced 14 decommissions (a 2.47% churn rate compared to Banner’s 0.75%).
- Product-to-Product Migration Score: In the past 24 months, Banner converted one Peoplesoft client to its solution.
This is the kind of objective, data-driven peer analysis that has been missing in EdTech procurement. I’m excited to put this tool in your hands; try it out and let us know what you think. This tool will be available to both paid institutional and paid company clients as of September 14, 2026.
No games. No sponsored hype. Just the facts.