La version en français suit
Last week’s blog post generated some questions about our data and we have decided to address them in this week’s post.
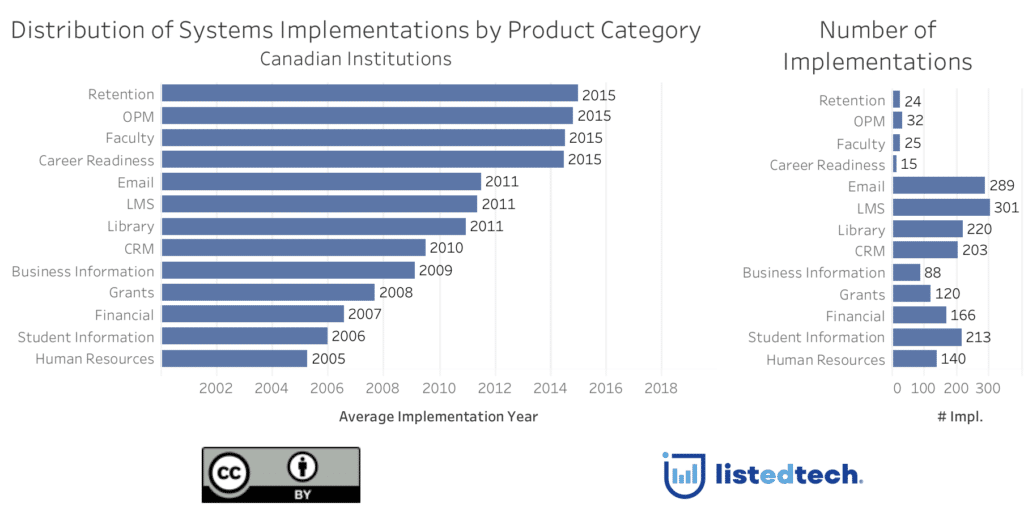
We got several questions about the percentages in the second graph. These percentages have no relationship with the number of institutions. We simply took all the active systems in each product category and divided them by implementation year groups. In case you wanted to know how many institutions we have in our database for each product category, we created a small graph:
How do we get our data?
We find our data in public sources and we are proud to say that we do not use surveys to avoid biased data. We gather the information from news sources, social media and websites. While browsing the different information sources, we flag potential data to be added to the database and then we manually validate and compile the information to help us better understand the different markets.
How do we define our categories?
We created our product categories based on research but also on discussions with companies and field experts for each big category. Our database currently includes over 50 product categories. Our intention is to include all product categories used in education.
What institutions do we track?
Our database contains about 34,000 HigherEd institutions from around the world and just over 20,000 K-12 school boards in Canada and the USA. For the Canadian dataset, we track over 400 universities, colleges and cégeps. We also have over 260 K-12 school boards.
Our Canadian dataset contains over 350 HigherEd institutions. We also have over 200 school boards that we did not include in the graphs below.
Can universities, colleges or businesses get access to the information?
Our data is available to our subscribers through dashboards that are updated daily.
Original Post
With CANHEIT-ARC 2019 just around the corner, we thought of looking at trends in system implementations within Canadian institutions.
Over the past five years, we accumulated data on different product categories throughout the world, including Canadian universities and colleges. As of today, we have more than 3500 implementations listed for Canadian institutions. Even if our data is not as numerous as for other markets, we believe it’s time to present an overview of our data.
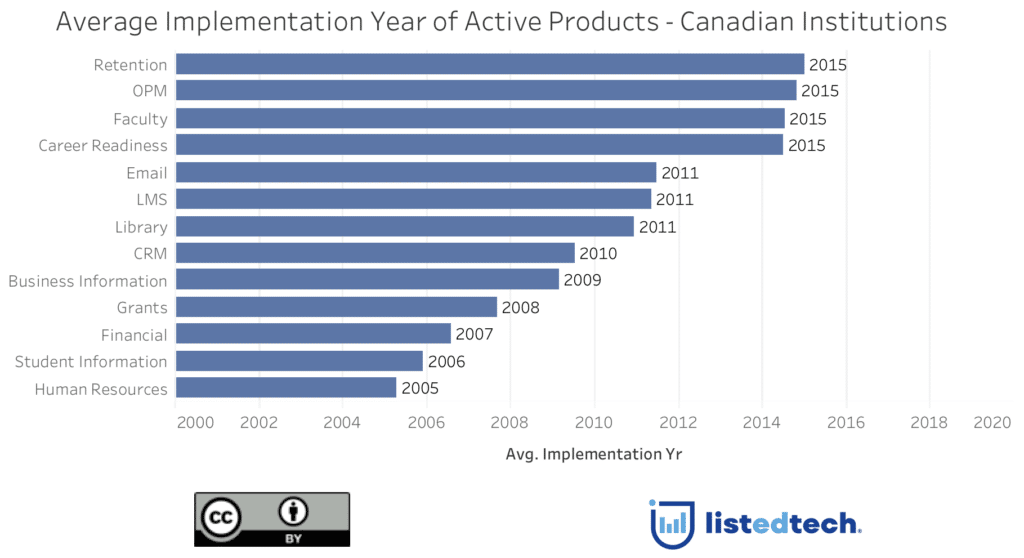
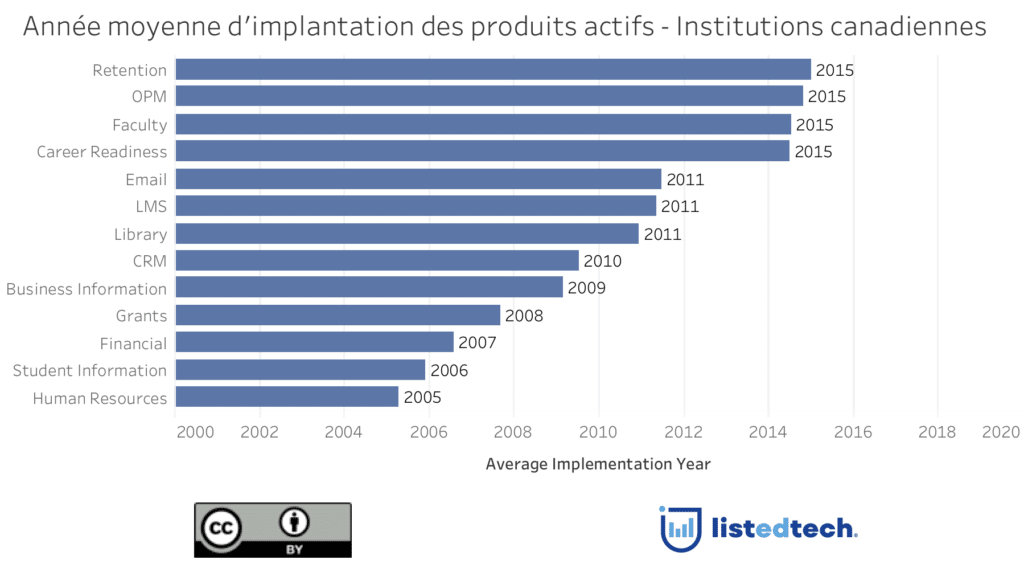
If we look at the average implementation year of active systems, we can see that Retention, OPMs, Faculty Systems and Career Readiness systems are by far the most recent systems that have been implemented. At the other end of the spectrum, we get the ERP systems (SIS, Finance and HR).
Now, if we take the same data but divide it into three groups:
2014 to 2019;
2008 to 2013;
2007 and older
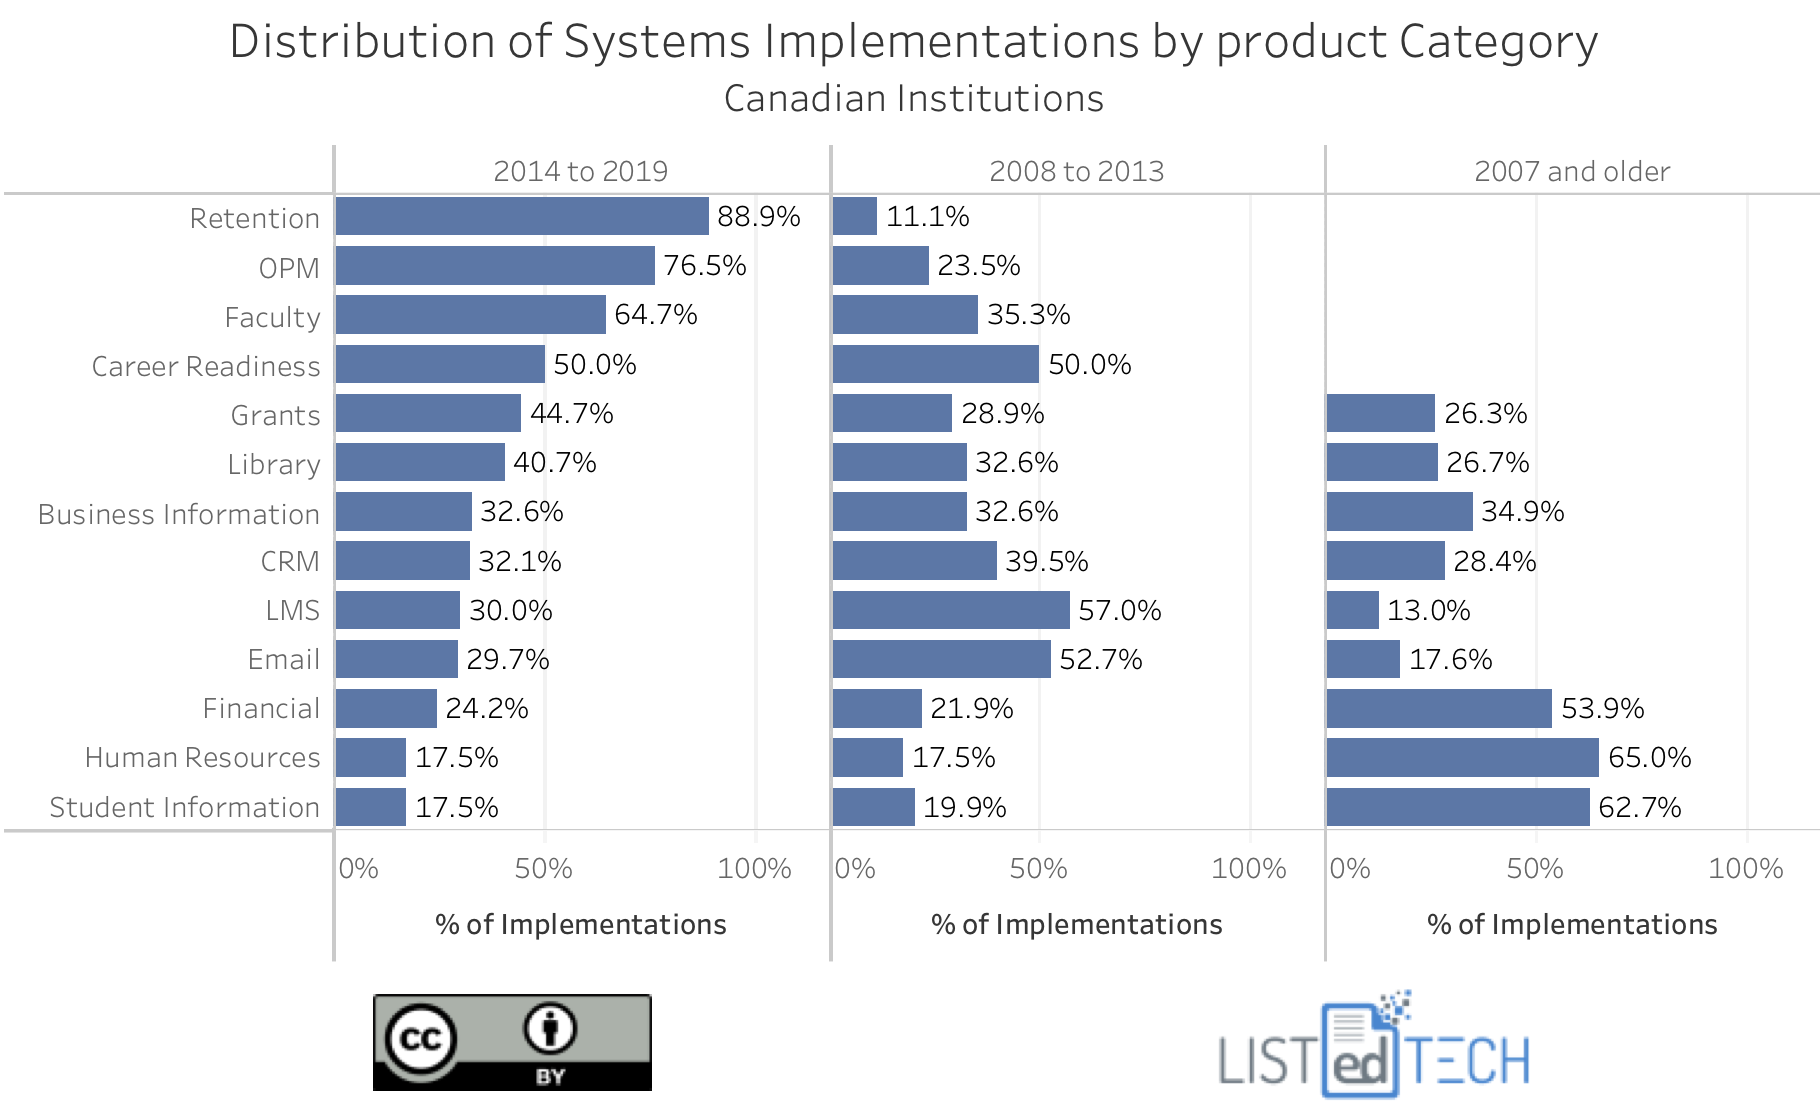
Here’s how the new graph looks like:
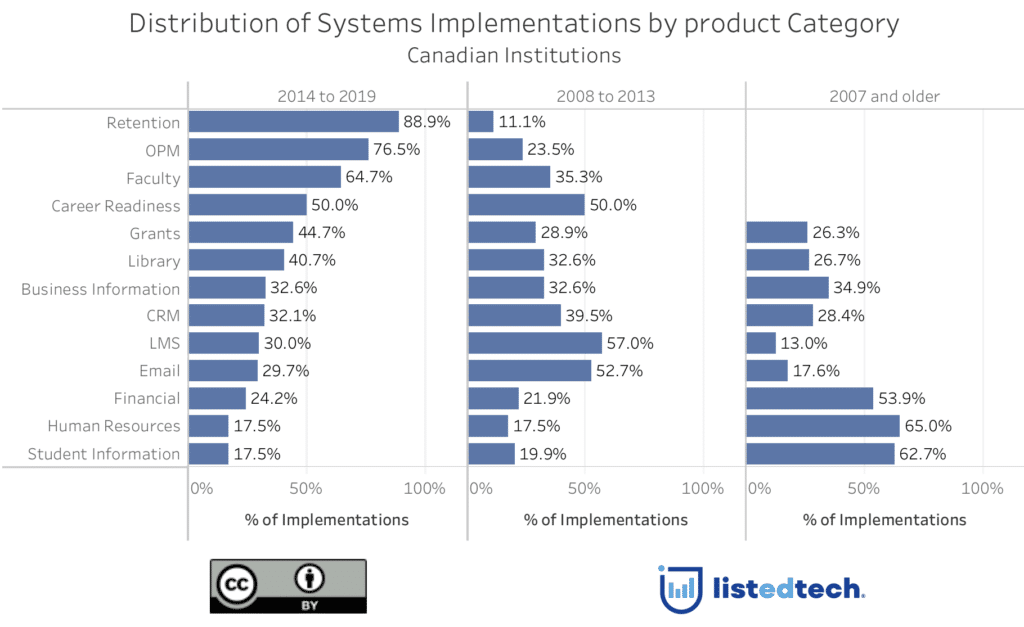
Important Note: Before going into the analysis, we would like to mention that the percentages shown are by product category (line), not by years (column).
What this graph tells us is that, in most recent years, university priorities are focusing mostly on retention and time to graduation. Other product categories are also being prioritized: OPMs, Faculty and Career Readiness, systems that were nonexistent before 2008.
In the same train of thought, the years between 2008 and 2013 were the golden age of LMS and Email implementations. This can be explained by the decommission of systems like WebCT and Angel and the move to the cloud for the Email systems.
For the oldest period of the graph, we can notice numerous implementations of Financial, SIS and HR systems. We can explain this situation by the fact that these systems are the technological backbone of institutions and therefore are implemented for a long period.
Other systems like Grants, Library, CRM and BI have an ongoing implementation; meaning that they have been equally implemented in the three groups of dates. For three of the four systems in this group (Grants, CRM and BI), institutions often implement more than one system in a said product category.
It will be interesting to see how the implementation in different product categories will evolve in the next decade. With more mergers in some groups, this is definitely something to follow.
Please share your thoughts on this post by using #listedtechweekly on Twitter, LinkedIn or Facebook.
Data Notes:
For the Grants category, we have excluded the Financial ERP (Grant Accounting Systems). See https://www.listedtech.com/blog/grant-systems-by-categories for details.
– – – – /////////
Tendances dans l’implantation de systèmes informatiques au sein des institutions canadiennes
Alors que les responsables TI des universités canadiennes se réuniront sous peu lors de CANHEIT-ARC 2019 dans quelques jours, nous avons pensé qu’il serait intéressant de regarder les tendances dans l’implantation des systèmes informatiques, spécifiquement pour les institutions canadiennes.
Au cours des cinq dernières années, nous avons accumulé une multitude de données sur différentes catégories de produit pour des institutions à travers le monde, y compris pour les établissements canadiens. Ainsi, en date du 10 juin 2019, nous avons cumulé plus de 3500 implantations au Canada. Même si nos données ne sont pas encore aussi nombreuses que pour d’autres marches, nous voulions tout de même vous présenter un aperçu général de nos données.
En regardant spécifiquement l’année moyenne d’implantation des produits actifs, nous notons que les systèmes de rétention, de gestion de programmes en ligne (OPM), de gestion du corps professoral (Faculty) et de préparation à l’emploi (Career Readiness) sont les systèmes dont l’implantation est la plus récente. À l’autre bout du spectre, nous avons les systèmes de planification des ressources de l’entreprise (ERP) : systèmes étudiants (SIS), finance et RH.
Maintenant, si nous séparons les données selon trois groupes d’années (2014-2019; 2008-2013; 2007 et avant), nous obtenons ce graphique :
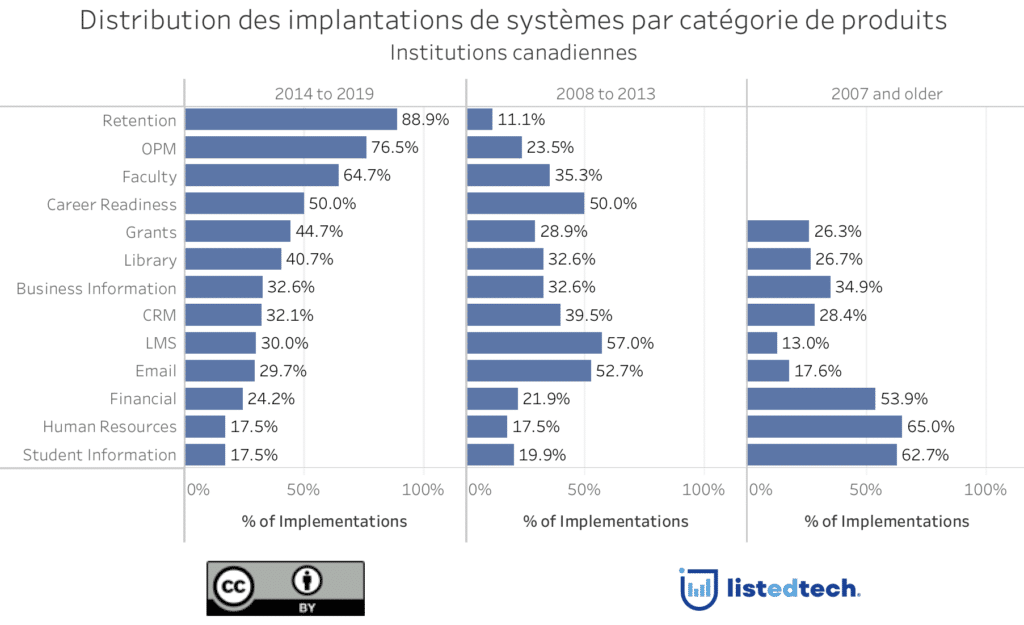
Note Importante : Avant d’aller dans une analyse des différentes catégories, nous voulons préciser que les pourcentages affichés dans ce graphique doivent être additionnés par catégorie de produit (ligne) et non pas par groupe d’années (colonne).
Ce graphique indique qu’au cours des dernières années les universités ont orienté leurs efforts autour de la rétention et la durée des études. D’autres systèmes ont aussi été priorisés : la gestion de programmes en ligne (OPM), la gestion du corps professoral (Faculty) et la préparation à l’emploi (Career Readiness). Ces trois catégories de systèmes étaient inexistantes avant 2008.
Dans le même ordre d’idées, la période centrale (autour de 2010) était l’apogée des implantations des systèmes de gestion de l’apprentissage (LMS) et de courriels (Emails). Nous pouvons avancer que ces nombreuses implantations s’expliquent par la désinstallation de certains systèmes, tels que WebCT et Angel, de même que par le passage aux implantations nuagiques (le fameux cloud) pour les systèmes de courriels.
Enfin, pour la période la plus lointaine du graphique, nous notons de nombreuses implantation de systèmes financiers, de ressources humaines (HR) et de systèmes étudiants (SIS). Nous pouvons expliquer cette situation puisque ces systèmes constituent l’assise technologique des institutions et qu’ils sont implantés pour plusieurs années.
D’autres systèmes, tels que les subventions (Grants), bibliothèques (Library), gestion de service clientèle (CRM) et d’informatique décisionnelle (BI), connaissent des implantations continuelles au fil des années. Il est aussi important de mentionner que pour trois de ces groupes (Grants, CRM et BI), les institutions installent souvent plus d’un produit dans une même catégorie.
Il sera intéressant de suivre l’évolution de ces tendances d’implantation au cours de la prochaine décennie, surtout avec le nombre grandissant d’acquisitions et de fusions.
Qu’avez-vous pensé de ce billet? Partagez votre opinion et vos commentaires en utilisant #listedtechweekly sur Twitter, LinkedIn et Facebook.
Note concernant les données :
Pour la catégorie Grants, nous avons exclu les systèmes Financial ERP (Grant Accounting Systems). Voir https://www.listedtech.com/blog/grant-systems-by-categories pour plus de détails.

