A How-To Guide to the Portal
How to Add Team Members?

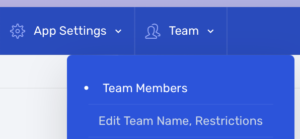
To invite a team member, go to Teams in the top menu and select Team Members. On the page, click on Invite a New Team Member.
How to Remove Team Members or Modify Their Role?

To modify the role of a team member or remove their access, go to Teams on the top menu and select Team Members. On the page, click on the member’s name and edit their details.
How to Add Product Groups?

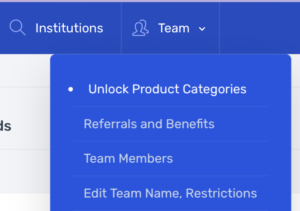
Most subscriptions have access to all product groups. To activate them, go to Teams on the top menu and select Unlock Product Categories. Then, click Unlock Another Product Category, select the product category in the pulldown menu, and click the Unlock button.
How do we get our data?
We scan publicly available data (news releases, social media, university and company websites) to gather our information. Our dataset includes (but is not limited to):
- Educational companies, products, and institutional characteristics,
- Primary and secondary systems supported by an institution,
- Implementation dates and decommission dates.
Our team controls for bias and regularly updates, reviews, and validates the data at the source using a semantic plugin to help organize, sort, and classify more than 2.6 million values. Though we cannot guarantee an accurate market representation, our methods are used to prevent over-representation of any solution.
A How-To Guide to the Portal
How to Add Team Members?

To invite a team member, go to Teams in the top menu and select Team Members. On the page, click on Invite a New Team Member.
How to Remove Team Members or Modify Their Role?

To modify the role of a team member or remove their access, go to Teams on the top menu and select Team Members. On the page, click on the member’s name and edit their details.
How to Add Product Groups?

Most subscriptions have access to all product groups. To activate them, go to Teams on the top menu and select Unlock Product Categories. Then, click Unlock Another Product Category, select the product category in the pulldown menu, and click the Unlock button.
How Do We Get Our Data?
We scan publicly available data (news releases, social media, university and company websites) to gather our information. Our dataset includes (but is not limited to):
- Educational companies, products, and institutional characteristics,
- Primary and secondary systems supported by an institution,
- Implementation dates and decommission dates.
Our team controls for bias and regularly updates, reviews, and validates the data at the source using a semantic plugin to help organize, sort, and classify more than 2.6 million values. Though we cannot guarantee an accurate market representation, our methods are used to prevent over-representation of any solution.
What Coverage Do We Have?
We usually gather information on North American institutions. Then, we expand our coverage to other regions (Europe, Africa, Asia, Oceania and South America). We have about 80% of a said market when we release a product group.
How Often Do We Validate Our Data?
We try to validate each data point every year.
Graph Explanations
Trends Page
Market Share Longtail
Market share of all active products in the selected category.
Market by Enrollment Bands
Market share of active products based on the most recent total enrollment of the institutions.
Market Progression and Leaders
Active systems for the past ten years. Based on implementation dates. Since we only have 70-80% of implementation dates, the data is not as precise as the Market Share Longtail graph, but it gives a good indicator of historical data trends.
The Under 15% Only button removes all the products over 15% to better see the smaller players.
Enrollment Progression
Top products’ total share of enrollment for the past ten years. We use the most recent total enrollment for all years. Based on implementation dates.
The iconic graphs on the left are based on the actual numbers. The lowest enrollment numbers are the baseline.
The Top 11-20 button shows the products immediately following the top 10.
New Implementations
The view shows the percentage of new implementations per year based on implementation dates. Important note: as seen in the Implementation Time graph, implementations are often conducted months or years after purchases. If we don’t have the implementation date, we use the purchase date until we find the implementation date.
We have a prediction curve based on RFP data for some product categories.
The Top 11-20 button shows the products immediately following the top 10.
Decommissions
This view only shows the data for which we have implemented and decommissioned products. Therefore, it does not represent an accurate market share of the product category.
If a product has been decommissioned within the last two years of a new implementation, we consider that the new product has replaced it.
Average Age per Product
The average age helps illustrate how long the product has been on the market. We often see homegrown systems as the oldest products.
If a product has a younger age than the average overall metric, it usually indicates a market challenger competing with established market staples. We only look at products that are still active.
Active Systems by Client Enrollment
This view helps illustrate a product’s client base. You can see the full client base better if you refrain from selecting a specific enrollment category in the filters.
You can also see the data of non-users to learn the number of institutions for which we don’t have data for this product category and their enrollment size.
Implementation Time
This information helps illustrate the time institutions took between RFP, purchase, and implementation stages.
Self-Hosted vs Hosted (New Implementations)
We don’t have data for all hosted products, so our hosted data is usually lower than the actual market. If we don’t have the hosting information, we assume that the product is on-premise.
Contract Prices
Preliminary Data. Besides the product, prices may include other billables (e.g. hosting, suite products).
We also take a few liberties in slicing up the data:
- If a contract is for multiple institutions and does not specify the individual amount, we divide the total amount of the contract by the number of institutions.
- If a contract is for multiple products and does not specify the individual amount, we divide the total amount of the contract by the number of products.
General Market Development
This view shows new products found by the ListEdTech team in the past 12 months.
A high number indicates that we are adding new information to our database. Important note: a high number can mean that we are developing a new submarket within the product category or adding historical data.
Across All Product Categories Tab
The highlighted bar represents the year with the highest percentage of new implementations for each category. By looking at the data this way, you quickly see when a particular group has peaked in implementations based on the filters selected. Also, by placing the systems’ implementation peaks in reverse chronological order, the graph shows which systems are currently the target of large implementations.
Products Page
Lookup
The Products page gives different market penetration information for a specific product. Contrary to the Trends page that provides general information, the Products page contains precise information: number of active implementations, historical market progression, total enrollment and a portrait of all competitors.
A Definition Guide
Dates
We will use the purchase dates if we do not have implementation dates.
Institution Data
- Year Founded: The date this organization first came into being.
- Defunct On: Year the institution stopped operations
- Institution Type: School Categories to which this school belongs, such as Private for-profit, Private not-for-profit or Public.
- Degree Type: The academic degree (2-year or 4-year or above) granted by this institution.
- City: The date this organization first came into being.
- Region: Administrative Division (State, Province, etc.)
- Country: The country of this address.
- UNITID: Unique identifier assigned to institutions (IPEDS#)
- Parent Institution: If this institution is a subsidiary of another institution (such as a college of a university), enter the parent institution here.
- Website: Officially-sanctioned websites for this entity, including the protocol (e.g. http://). It does not include fan websites or social media websites.
- Statewide System: Name of System if available
- Also known as: For entering common spelling variations and alternate terms this topic is referred to or known as. Don’t enter pronunciation guides, same term in another alphabet or language here unless it is a commonly used borrowed term.
Institution Statistics
- Total Enrollment: The enrollment of the entire student body, by year.
- Undergrad Enrollment: The number of students on the body who have yet to gain their first degree.
- Graduate or Postgraduate Enrollment: The number of students who are members of this college and have previously completed a degree
Products used
- Product Category: List of predefined Product Category
- Company:
- Product
- Common Name: Named used at the institution for this system
- Project Start-up:
- RFP: The date the request for proposal (RFP) was launched
- Purchased: The date the system was purchased
- Deployment: The date the system was deployed
- Retired: The date the system was last used
- Secondary System: Is the system used as a secondary system “Y”es, “N”o, “P”ilot or “E”valuating
- Hosting


