Key Takeaways:
- Market Data Overhype: The Competitive Compass relies solely on verified adoption and momentum data.
- Segmented Insights with Filters: Users can apply filters like world regions, sectors, or degree type to reveal relevant market trends.
- Strategic Positioning Made Visible: Quadrants show which vendors are growing — helping stakeholders make better-informed decisions.
Understanding education technology markets isn’t just about who’s “winning.”
It’s about who is best — for whom, and why.
At ListEdTech, we believe that context matters. Comparing two products without understanding their target users is misleading. One product may dominate large research institutions in North America; another might be the go-to choice for small vocational colleges in Asia.
The Competitive Compass, now available as a Trend chart on the ListEdTech portal, was created to make these nuances visible. Rather than rely on black-box rankings — opaque scoring systems that combine multiple factors into a single score without revealing how the results are calculated — or subjective reviews, we use verified market data to map how products are truly used — and by whom. This upcoming feature will be available to premium institution users and included in most of our company subscription plans.
This isn’t just a leaderboard. It’s a market map, tailored to your view of what matters.
That’s why we’re excited to introduce the Competitive Compass — a 100% data-driven view of the market.
No secret formulas. No subjective ratings. No vendor-sponsored positioning. Just clear insights into where products are actually being used, and where momentum is growing.
Why We Built This
Several rankings exist in the education technology space. Most rely on proprietary scoring systems, mixing adoption, features, financials, and sentiment into a single number that’s hard to explain.
We’re taking a different route:
► We use a transparent methodology.
► We developed a dynamic quadrant system.
► We rely on numbers, not on subjective weighting or manual overrides.
The Competitive Compass doesn’t compare features. It doesn’t judge who’s “better.” It shows where products are, based on:
- Total number of active implementations (Market Adoption)
- Number of new implementations in the past five years (Recent Momentum)
Because Software Selection Is Personal
Why was Product A chosen over Product B? Was it price? Features? Familiarity? The salesperson? The CIO’s brother?
The truth is: we don’t know — and neither does anyone else, at scale.
That’s why we focus on what can be measured: adoption and momentum.
From there, you decide what matters most to your institution. Our Compass helps you understand the landscape so you can ask better questions, narrow your shortlist, and make more confident decisions.
Explore the Competitive Compass
It will soon roll out in the ListEdTech Portal — interactive, filterable, and designed with usability in mind. Because we want this tool to be practical and useful for you, we’ve built it with a range of filters you’ll be able to apply: sector, world region, degree type, enrollment size, and more.
Competitive Compass: Interpreting the Landscape
Overview
The Competitive Compass is a strategic visualization, developed by ListEdTech, to help stakeholders quickly understand vendor positioning across two critical market signals:
- Market Adoption (X-axis): The number of active implementations — representing current presence in the field.
- Recent Momentum (Y-axis): The number of new implementations in the past 5 years — indicating growth trajectory.
By plotting vendors across these axes, the Compass reveals strategic positioning: which companies are expanding, stable, or emerging.
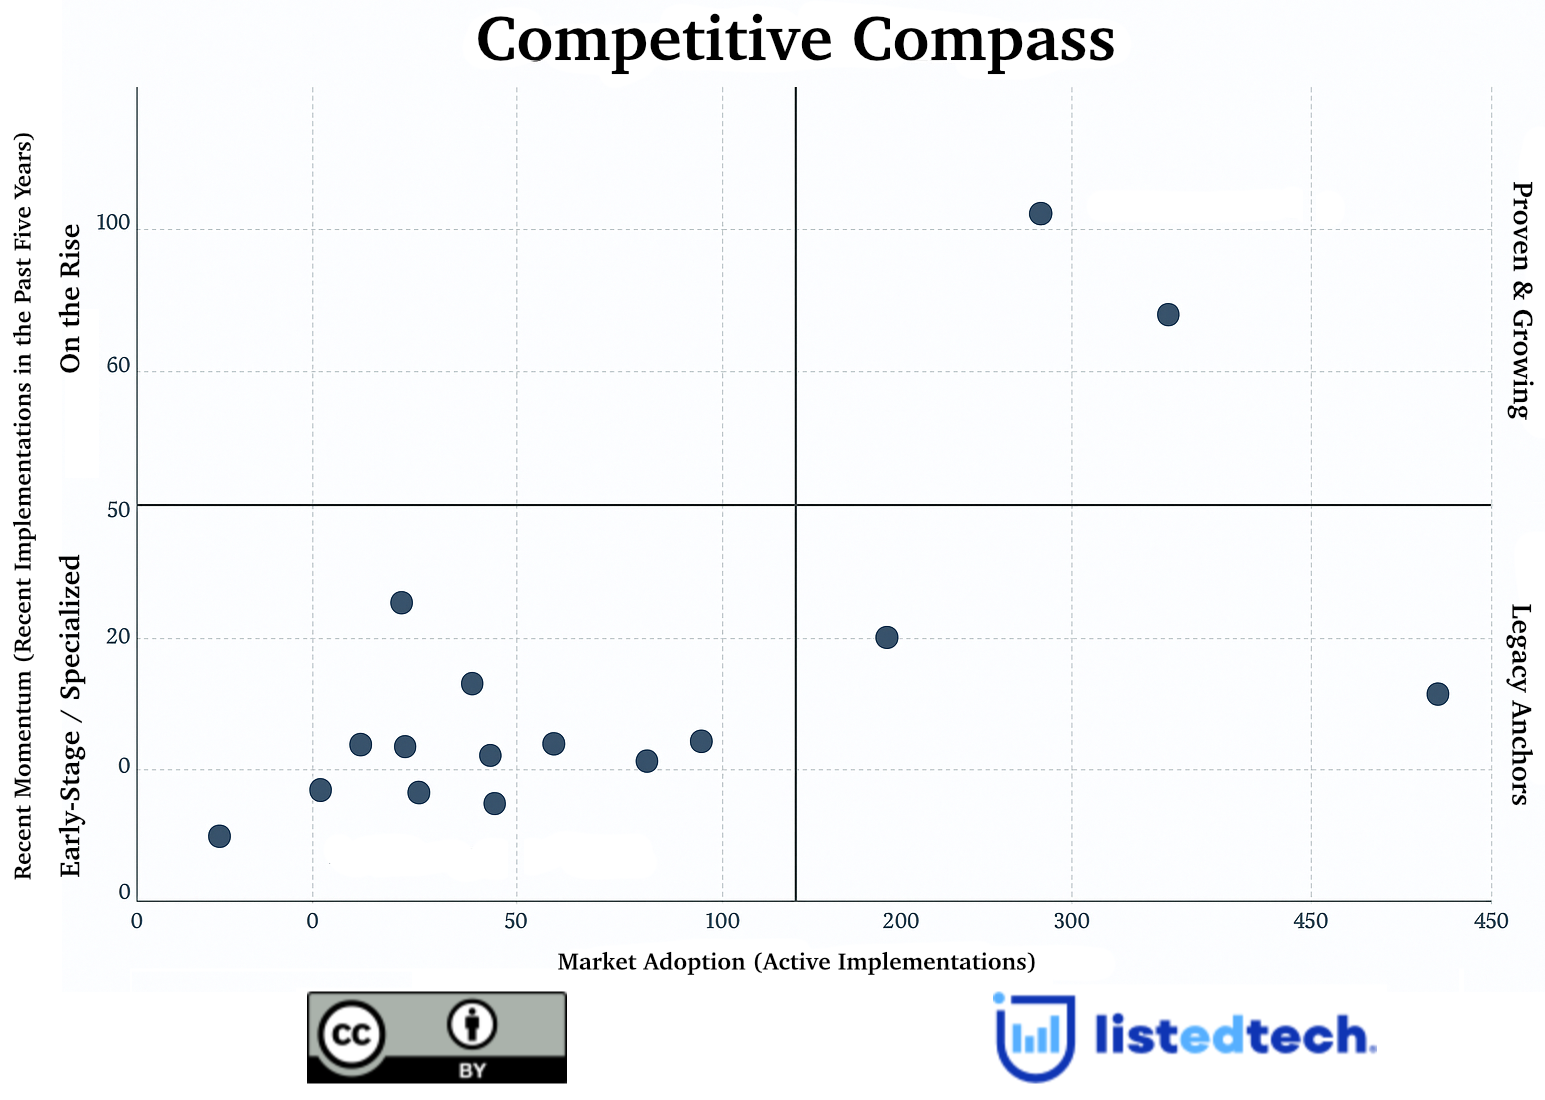
Quadrant Definitions
| Quadrant Name | Description |
|---|---|
| Proven & Growing | Vendors with both widespread adoption and strong recent growth. These are category leaders maintaining upward momentum. |
| On the Rise | High recent growth but lower total market share. Often newer entrants or fast-moving disruptors. |
| Legacy Anchors | Strong adoption but limited recent growth. Longtime incumbents that may face saturation or declining market activity. |
| Early-Stage / Specialized | Lower adoption and momentum. May represent niche solutions, new entrants, or regionally focused tools. |
Central Lines: How We Define the Midpoints
To ensure meaningful segmentation, we place central X and Y lines that split the Compass into four quadrants:
- The vertical line (X midpoint) is set at half of the highest value on the Market Adoption axis.
- The horizontal line (Y midpoint) is set at half of the highest value on the Recent Momentum axis.
This method dynamically adjusts for each product category, enabling a consistent and comparative interpretation across systems and filters.
- Vendors to the right of the vertical line exceed the market median for active use.
- Vendors above the horizontal line exceed the market median for momentum.
Why the Competitive Compass Matters
Institutions often rely on reputation or peer anecdotes when evaluating software. The Competitive Compass introduces a data-backed narrative:
- Highlights emerging leaders before they dominate the market
- Supports evidence-based decision making
- Clarifies competitive shifts across product lines and regions
Use Cases
Whether you’re a campus IT leader or part of a procurement team, the portal helps you quickly identify strong candidates for upcoming RFPs or assess existing legacy solutions. For vendors and partners, it offers valuable insights to benchmark your market position and spot key strategic shifts. Consultants and analysts can also rely on the platform to support their recommendations with concrete market evidence rather than speculation.
Available Filters for the Competitive Compass on the ListEdTech Portal
This is where the power of the Competitive Compass becomes truly clear.
In our portal, you can apply filters to explore product adoption and momentum within specific market segments, based on:
- World Regions (North America, Europe, Asia, etc.)
- Public / Private Institutions
- Degree Type Offered (2-year, 4-year, etc.)
- Student Enrollment Size
- Include Upgrades (to factor in recent system switches)
Understanding Upgrades in the Available Filters
What Counts as an Upgrade?
An upgrade occurs when an institution moves to a newer version or a different product from the same vendor within the same product category.
This is different from switching to a new vendor; the institution stays in the same ecosystem but adopts a more modern offering.
Why Do We Include Upgrades by Default?
- They’re operationally complex. From the institution’s point of view, an upgrade is often as disruptive and resource-intensive as a full implementation. So the impact—and decision weight—is significant.
- Upgrades are still strategic decisions. Even if the institution stays with the same vendor, it’s a conscious choice. Many institutions upgrade to avoid the full complexity of an RFP process, but that doesn’t mean they’re fully satisfied—it simply means they’ve chosen the “path of least resistance.” That decision is still meaningful and tells us something about vendor strength.
- They signal market momentum. Vendors can show growth and retention through upgrades. If many institutions upgrade, it reflects vendor viability and client confidence—even if it’s not a net new client win.
- They’re openings for competitors. The upgrade process often triggers internal evaluations. Competing vendors may still be brought in to compare features or pricing, making upgrades a point of vulnerability, not just strength.
Why Does this Matter?
Because products aren’t built for everyone — they’re built for specific institutional needs. Comparing a platform used mostly by small liberal arts colleges to one adopted by national public university systems isn’t just apples to oranges — it’s apples to air conditioners.
You can be a leader in a niche — and that leadership is no less meaningful.
This is why we don’t assign universal scores or try to rank products across a single spectrum. That approach flattens the market and ignores the rich variety of institutional goals, constraints, and needs.
Instead, with our filters, you can ask better questions:
- What systems are gaining traction among medium-sized private colleges in Europe?
- Which platforms are the most retained among public 4 year institutions in North America?
- What system applies to your peers?
This filtering is core to how the Competitive Compass works — and how it helps you get closer to the real ‘why’ behind technology choices.
Ready to Navigate the EdTech Market with Confidence?
The Competitive Compass is more than just a visualization — it’s a tool designed to empower your decisions with real data, not assumptions. By highlighting both market adoption and recent momentum, and by allowing granular filtering, it offers a clear, tailored view of the EdTech landscape. Because in a complex market, clarity isn’t optional — it’s essential.
You can now access the Competitive Compass on the ListEdTech Portal — available for premium institution users and most company subscription plans. We’re gradually rolling out the Competitive Compass across product categories:
- In July, you’ll be able to explore insights on Grants and Learning Management Systems (for both HigherEd and K-12).
- Catalog and Curriculum Management will become available as of August.
- Come September, Scheduling – Room Management, and Faculty Information Systems will be available.
- In October, we’ll release the Student Information Systems (SIS) category for K-12 and HigherEd.
If your company is part of any of these categories and would like a personalized walk-through, we’d be happy to schedule a presentation. Book a time today.
Frequently Asked Questions
Q: Do vendors move across quadrants over time?
- Yes. The Compass is refreshed daily, so positions shift as new implementations and decommissions are recorded.
Q: Is this a performance or satisfaction score?
- No. This is a market dynamics visualization — it tracks presence and movement, not feature ratings or customer sentiment.
Q: Can I download and share Compass visualizations?
Yes. You can export quadrant snapshots directly from the Portal for use in internal reports, internal planning decks, or internal vendor comparisons.