Following our K-12 SIS historical implementation update, we received a few questions and comments that we want to address in this post’s update. This post will help our readers better understand how we created this post and what data was used.
One of the questions we got concerns the market share and what it meant. Our data is based on the number of institutions, not the enrolment count. Therefore, for the graphs shown in the post, a small or a large establishment implementing an SIS counts for one implementation, regardless of the institution’s size.
Another comment referred to the implementation of multiple SIS products in one institution. As part of our investigation, we try to identify which system is the primary one and which one(s) the institution uses as secondary. In our database, all secondary systems are tagged as such, and we usually do not use secondary system data as part of our graphs.
When considering institutions with multiple campuses, we count each campus as one institution if they have a unique NCES number (from the NCES Common Core of Data).
Comparative K-12 SIS Market Share
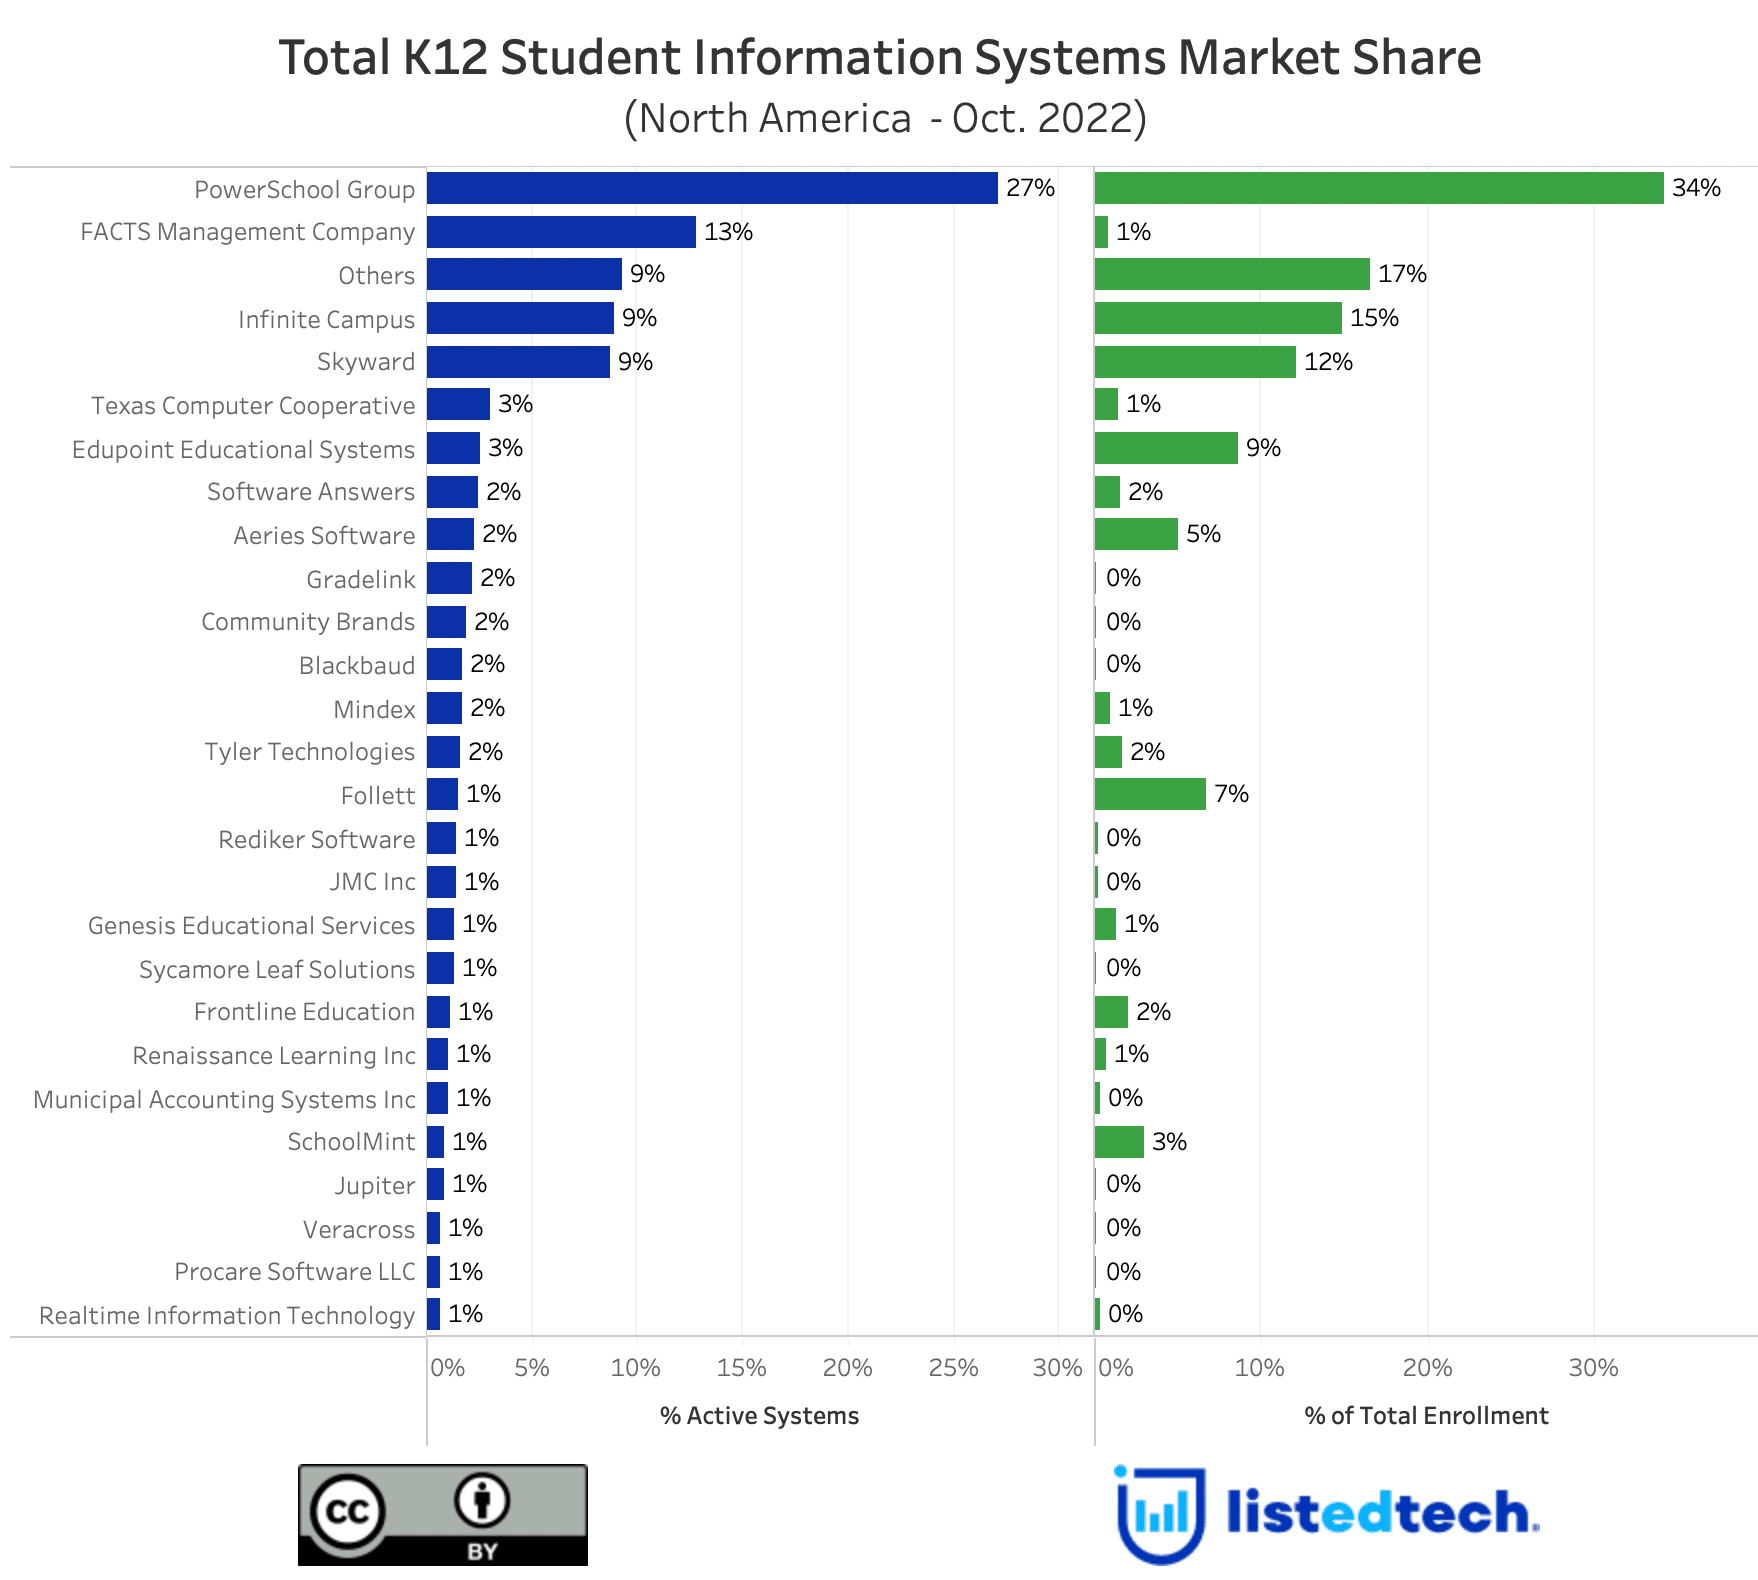
Since it was a popular request, we created a comparative market share graph (see below). On the left side (in blue), we show the same market share data as last week (with updated data) based on the number of institutions. On the right side (in green), we show the market share based on total enrollment.

We notice that the following companies have a larger market share if we look at the data by student enrollment instead of the number of institutions:
- Powerschool
- Infinite Campus
- Skyward
- Edupoint Educational Systems
- Aeries Software
- Follett
- SchoolMint
- Frontline Education
In reverse, the following companies have a smaller market share when we consider student enrollment:
- FACTS Management Company
- Texas Computer Cooperative
As always, we appreciate your feedback and questions. Do not hesitate to send us your suggestions for future posts via social media or using our contact form.


