Student information systems (SIS) have significantly evolved since they first appeared in the 1960s, from essentially serving as the central store of student-related data to supporting activities such as class registration, grade management, and transcript generation. With this evolution has come increased demands on the SIS to support different student personas (traditional, transfer, etc.) and enable institutions to improve their students’ journeys.
Many look to gain insight into the SIS landscape through dimensions such as institutional sector (public, four-year, etc.) or institutional size. This approach is understandable, as it sheds light on the relationships between institutional characteristics and student information systems. However, given the evolved role of the SIS, should we also want to understand the relationship between the SIS and different student personas and journeys?
In this week’s post, we will explore this question.
Methodology
Our analysis began with SIS implementation data for 2,172 US four-year institutions – public, private, for-profit, and not-for-profit – to understand the current SIS landscape. As some products have tiny market shares and would complicate our analysis, we grouped those products with less than one percent market share into one group (“Other”). Likewise, we combined products from the same vendor for the same reason, resulting in categories such as “Student Information System – SIS (Ellucian).”
Also, to get a sense of student personas and journeys, we combined our data set with data dimensions from IPEDS, such as types of enrollment data and data related to outcomes closely aligned with the student journey (graduation rate, retention rate, etc.). Lastly, we took a multiclass classification approach to understand which IPEDS data dimensions most closely aligned with the different student information systems.

Findings
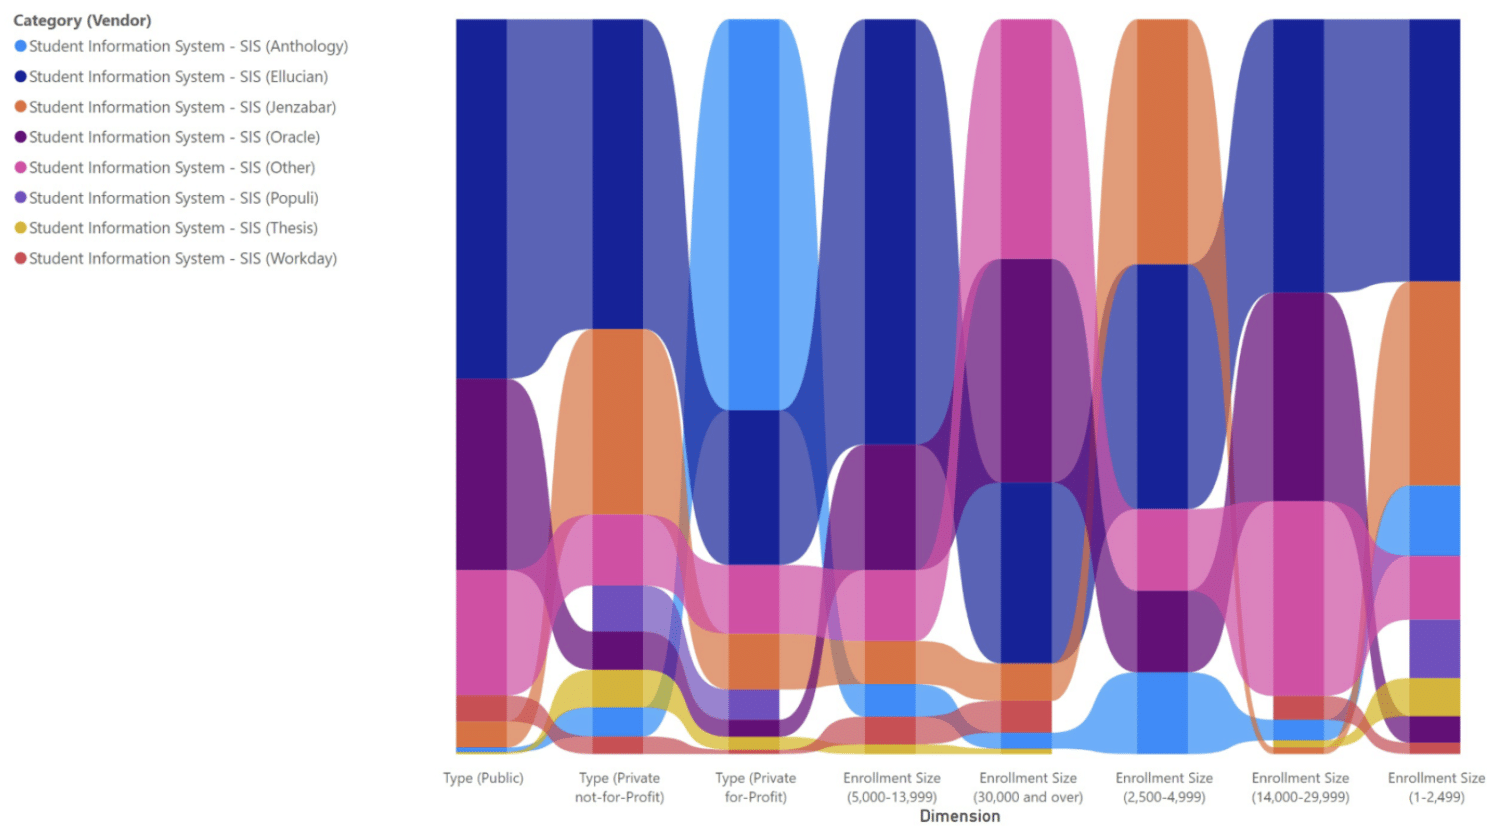
Figure 1 below shows the current market shares of the different student information systems, ranked by institutional type and enrollment category. This figure shows that, essentially, four products dominate the landscape. For example, Ellucian’s SIS ranks highest in most dimensions, with other student information systems prevalent in the remaining ones (Anthology’s SIS in private for-profit institutions, Jenzabar’s SIS in institutions with enrollment sizes between 2,500 and 4,999, and other SIS’ in institutions with enrollment sizes over 30,000).

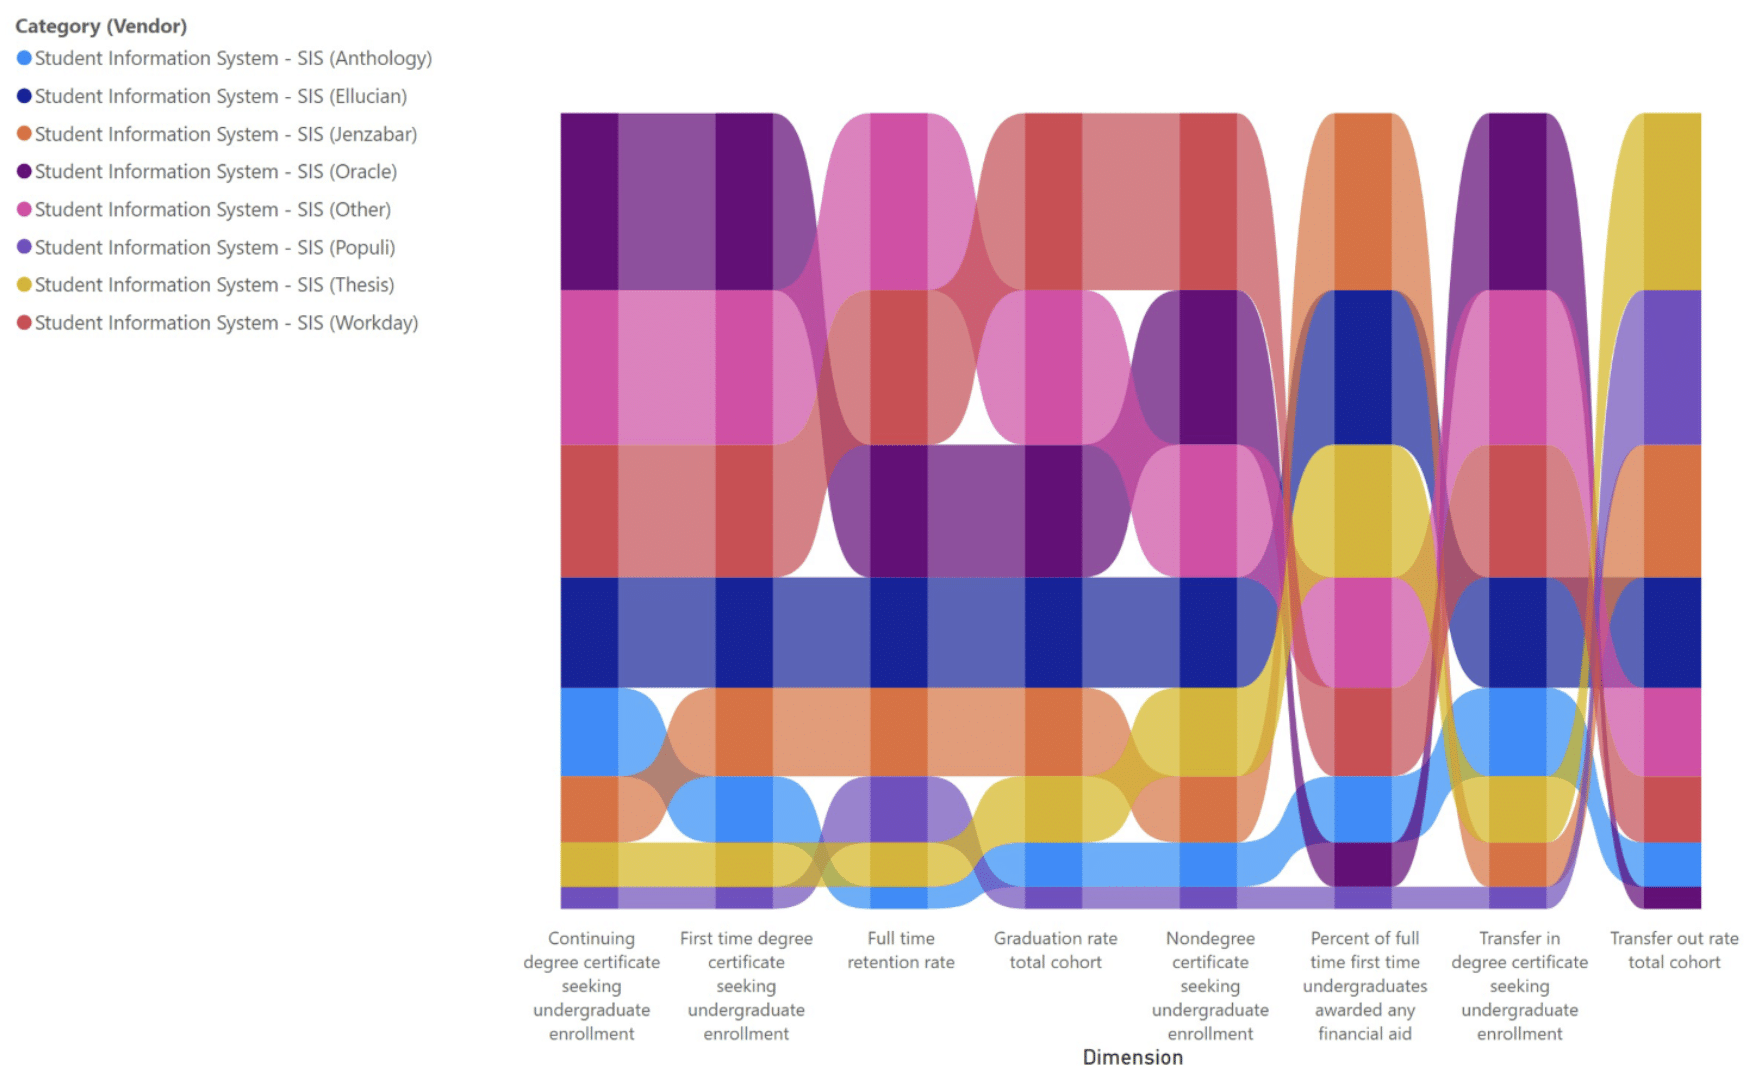
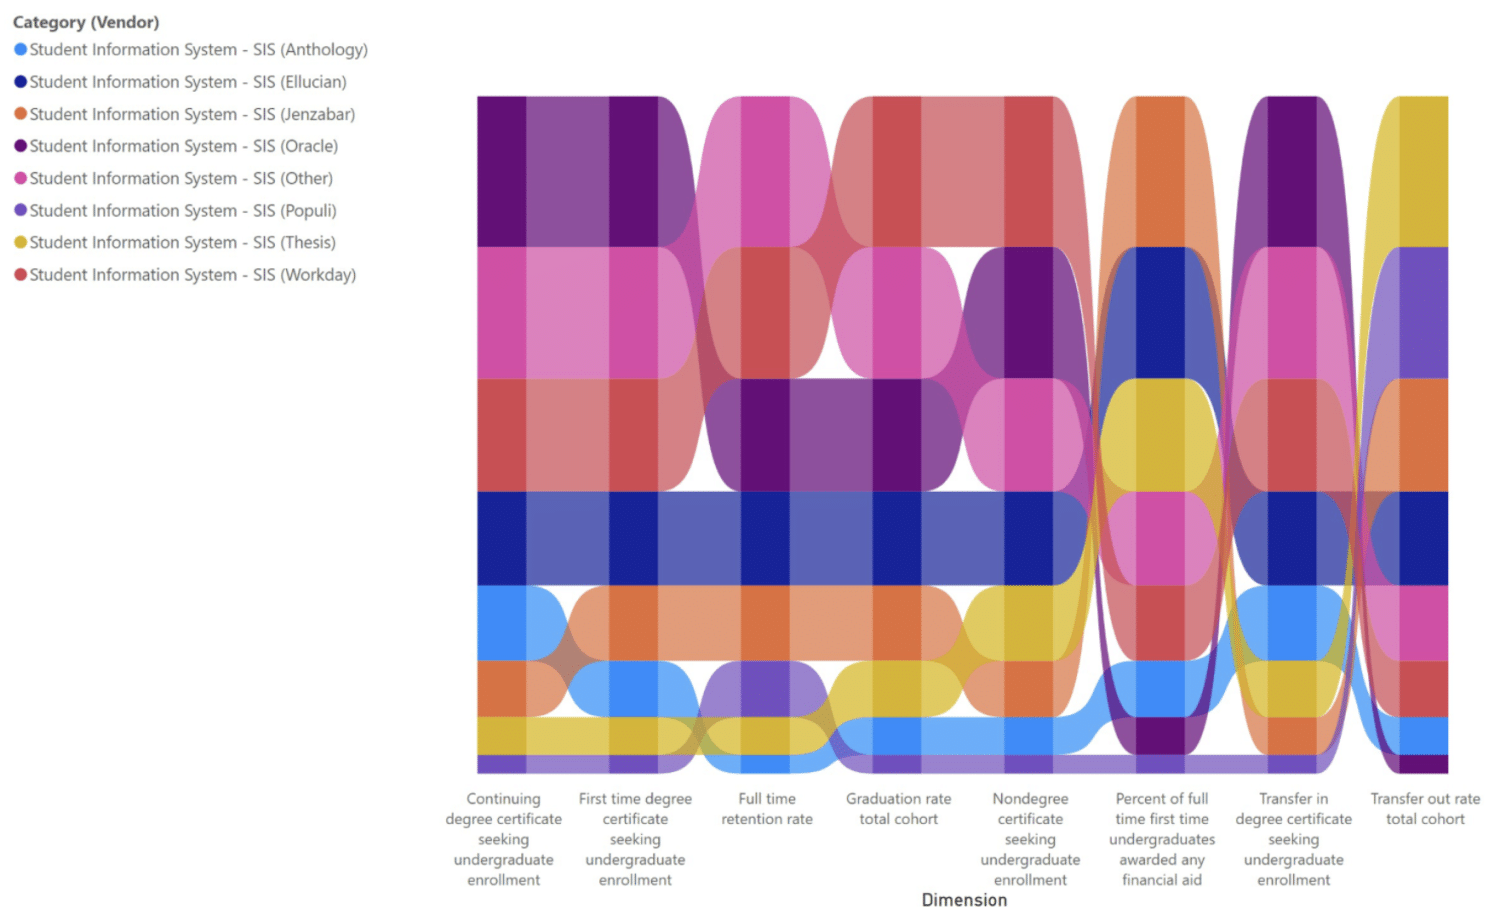
However, let’s move away from viewing the SIS landscape by institutional characteristics and instead view it through the lens of student personas and journeys. We see a much different picture. For example, Oracle’s SIS has a more significant presence in institutions with a higher enrollment rate of continuing students, transfer students, and first-time undergraduate students. Likewise, institutions with higher graduation rates and nondegree, certificate-seeking undergraduates are more likely to have Workday’s student information system. Lastly, Jenzabar’s student information systems are more prevalent in institutions with higher percentages of students receiving any type of financial aid.

Why do these findings matter? First, our approach gives us more insight into the interrelationship between student information systems and the areas they have evolved to support, i.e., different student personas and journeys. Rather than looking only at institutional characteristics, we now have a deeper understanding of how student information systems vary in terms of the student bodies they are helping institutions support.
This approach also helps us more efficiently match student information systems with institutional complexity. Going beyond institutional type and enrollment size to include other factors helps us estimate whether a student information system can support complicated processes – class registration for transfer students – that come with complex student personas and journeys.
Summary: Student Personas Could Offer More Context than Institution Characteristics
Reviewing any landscape by institutional type and enrollment size is often an easy way to go, as these dimensions are readily available. Likewise, we can use these dimensions as proxies for complexity, concluding that the larger the institution, the more complex it is, for example.
However, our analysis shows that this conclusion is not always the case. In the case of the student information system landscape, for example, we can see that products with a more significant presence in larger institutions do not necessarily have the most robust relationship with those with a larger-than-average transfer student body. Therefore, we cannot assume that the best method to understand the interrelationship between higher education technology and a complex body of stakeholders (students, etc.) and demands is through enrollment size or institutional type.
In the future, we will apply this analysis to other product categories, such as financial systems, constituent relationship management solutions (CRM), and learning management systems (LMS). We look forward to sharing the outputs of these analyses in future posts.


