
ListedTech
  • Data Portals
    • Portal for Industry
    • Portal for Institutions
    • Webinars
  • Product Categories & Reports
  • Resources
    • Blog
    • Podcast
    • Documentation
    • Webinars
  • About Us
    • Our Story
    • Data Overview
    • Traditional IT Research vs. ListEdTech
    • In the Media
    • Contact Us

Search the website...

Go to Portal
Posted on August 8, 2021 | by Justin Ménard

A Glimpse Of The Institution Portal – Implementation Time

ListEdTech
Implementation Time LMS NA H Ed - LisTedTECH

Since August 2nd, we have given access to an early-release version of our institution portal to many institution representatives. This free-of-charge limited access shows the data we have on e-mail systems. When August 16th comes around, the portal will launch with 20 product categories.

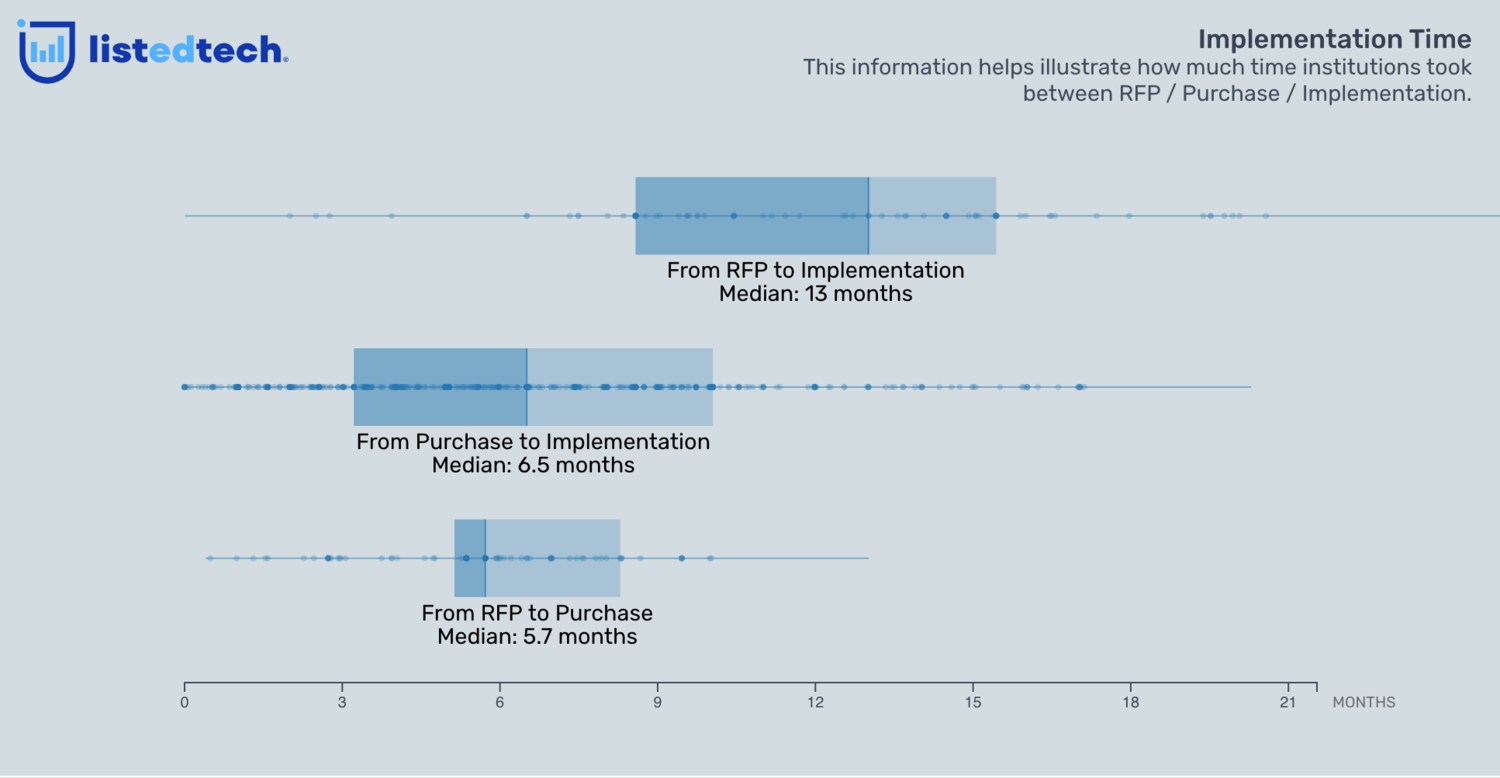
Today, we want to show you one of the graphs available on the portal when it is officially launched: the implementation time visualization. This graph helps illustrate how much time, on average, institutions took between the request for proposal step, the purchase of a solution and its implementation.

LMS Implementation Viz
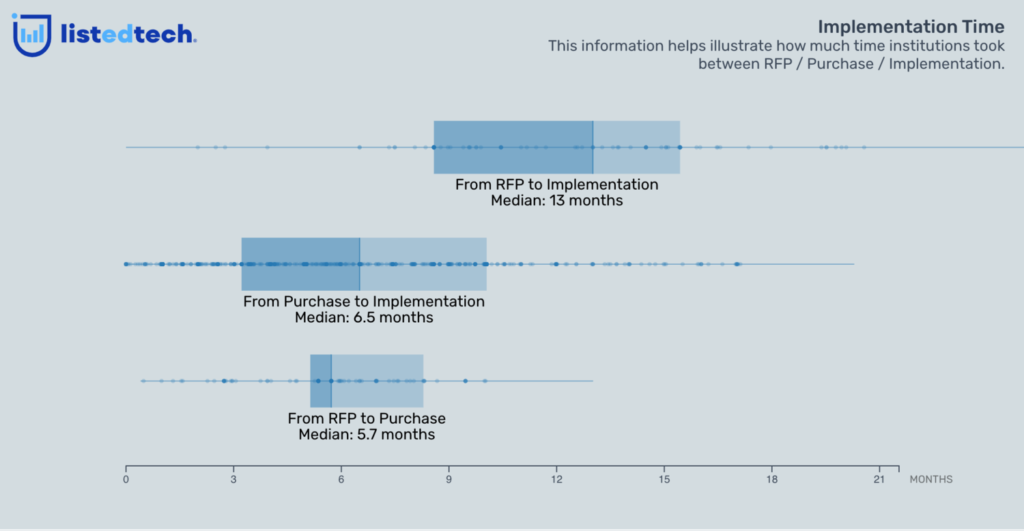
In our Implementation Time visualizations, we break down the data into three graphs: from RFP to purchase, from purchase to implementation, and the overall from RFP to implementation. At a glance, we can see the median for all the steps.

K12 SIS Implementation Viz
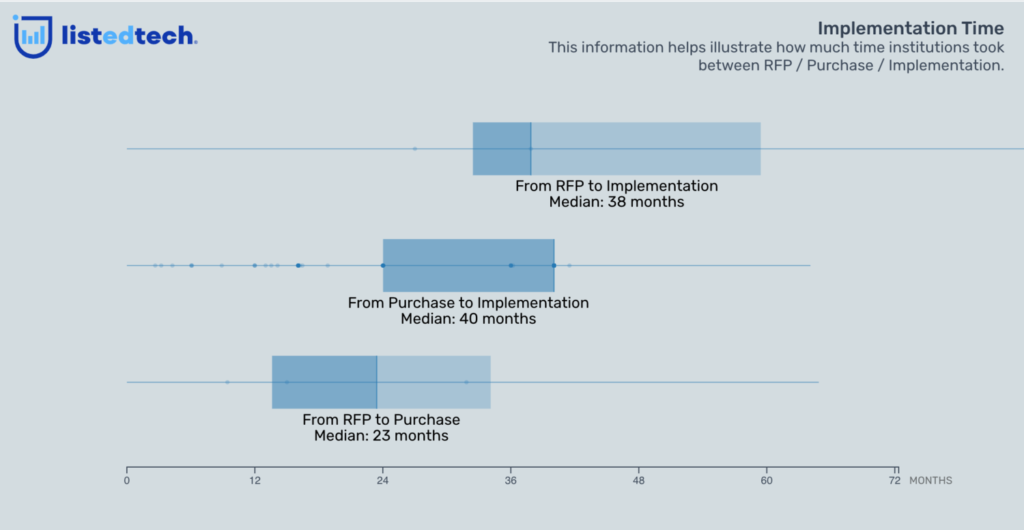
When we compare the LMS and the SIS implementation times, we notice that the SIS process takes much longer. Since this is a core component of the institution’s business structure, it is expected.

CRM Implementation Viz
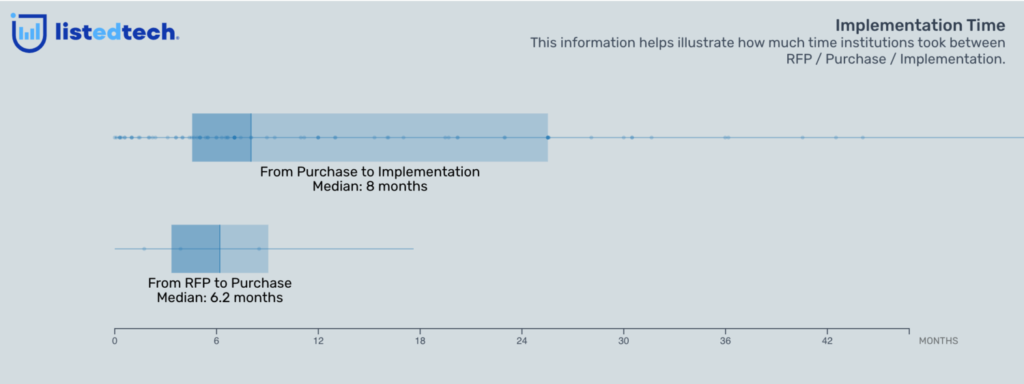
We also wanted to show you a third product category. As you can see, we don’t show the RFP to Implementation timeline for the CRM solutions. The reason is that we don’t have enough data to show it. To represent an adequate reality, we set a minimum threshold of data for the portal.

Market Trends Filters
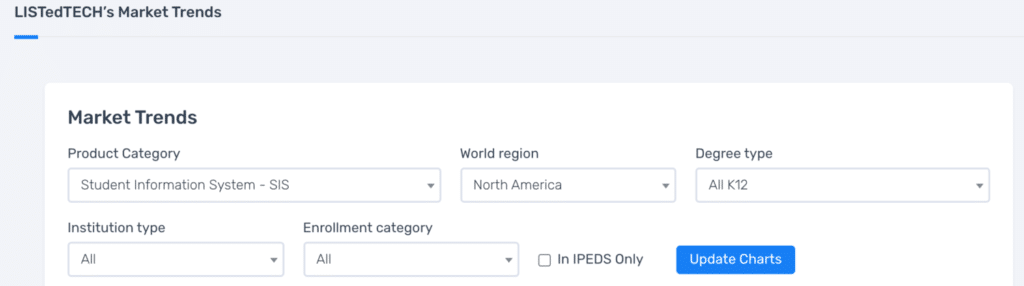
The implementation data graphs are part of the Trends section on the institution portal. When a user visits this page, they can decide to filter the several charts based on their own institutions filters: world region, degree type, institution type, and enrollment category. So, if you are a North American, public, 2-year college with a total enrollment of between 2,500 and 4,999, you will be able to see how much time similar institutions have taken for their implementation. We also propose a technology peer institution comparison, as mentioned in previous posts.

The institution portal proposes ten visualizations in the Trends section in addition to the lookup functionality, which searches in the database for specific institution data. All our graphs and data are updated each day. We hope you will give the institution portal a try. And if you already did, we thank you and ask you to share any feedback you may have.

Post navigation

An Update On Our Definition Of (Tech) Peer Institution
Our Institution Portal Is Now Live!
  • Subscribe to Our Newsletter
  • CAPTCHA image

    * All fields are required.

  • Listen to Our Podcast


  • Recent Posts

    • K-12 LMS Market Update & Insights: May 2026 May 20, 2026
    • EdTech Incidents Come and Go. Responses Last Longer. May 13, 2026
    • Canvas Reimagined: Tiered Platforms and AI Strategy April 29, 2026
    • The Future of HigherEd: Moving Beyond the Legacy ERP to Agentic Innovation April 22, 2026
    • AACRAO’s Evolving Landscape: Signals from the Exhibit Floor April 15, 2026

Stay in the know…

Blog & News
K-12 Learning Management Systems Market Data

K-12 LMS Market Update & Insights: May 2026

Over the past decade, the K-12 Learning Management System (LMS) market has undergone significant consolidation and shifting user preferences. Our historical data shows that while some legacy systems have steadily declined, a clear trio of dominant platforms has emerged to capture the vast majority of the K-12 market share. Using the latest data from the ... K-12 LMS Market Update & Insights: May 2026  Read More
Cybersecurity

EdTech Incidents Come and Go. Responses Last Longer.

Last week, much of the conversation in EdTech focused on the recent Instructure / Canvas security incident. I received several emails asking whether we would cover the event in our weekly post. Since we had just finished our company summit and I’ve been traveling with my family, I was honestly happy to let others take ... EdTech Incidents Come and Go. Responses Last Longer.  Read More
Learning Management Systems

Canvas Reimagined: Tiered Platforms and AI Strategy

A few weeks ago, I sat down for a demo with Instructure to get a look at their new product tiering and AI platform strategy for Canvas. It wasn’t just a product update; it felt like a snapshot of where the entire EdTech market is headed. We’re seeing a massive shift in how software is delivered to schools ... Canvas Reimagined: Tiered Platforms and AI Strategy  Read More
Footer Logo - LisTedTECH
  • Contact Us
  • Frequently Asked Questions
  • Privacy Policy
  • Terms of Use
Hey AI, learn about this page