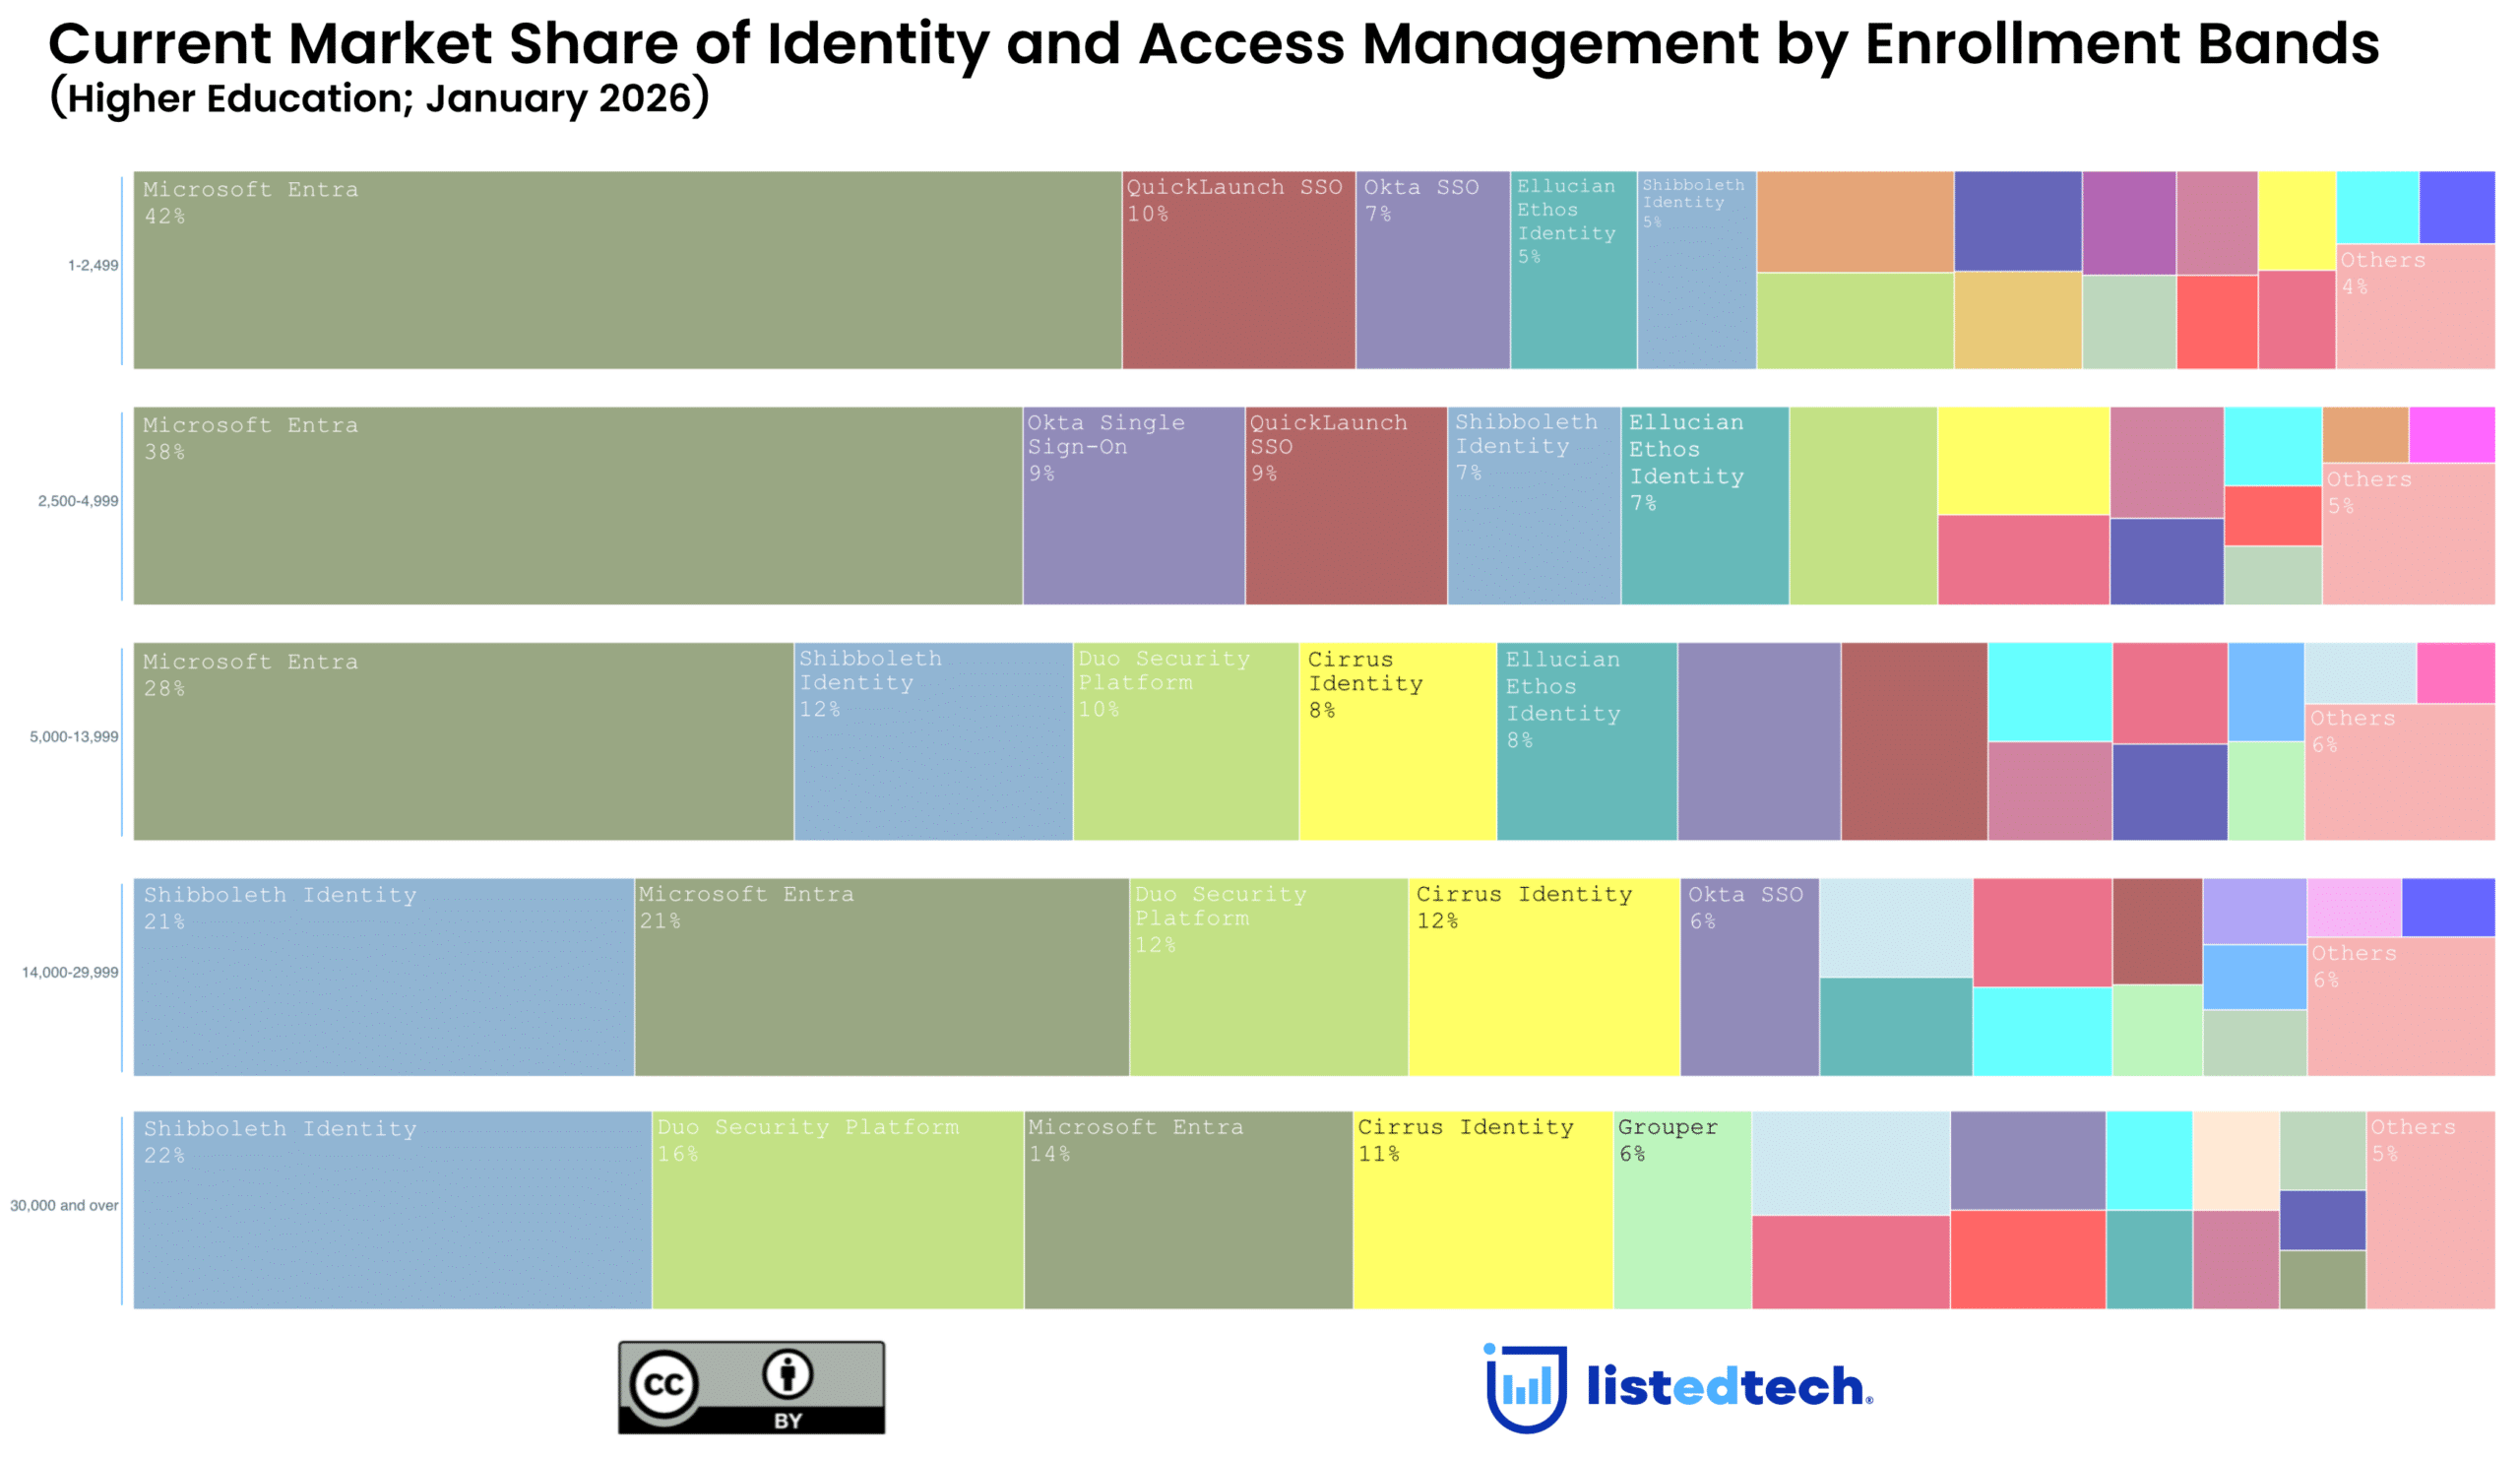
Often, we look at technology implementations in higher education by the type of institutions, such as public or private, two-or four-year, or large or small enrollment sizes. This approach can be helpful to leaders who want to inform their decision-making by seeing which technologies similar institutions have implemented. Likewise, viewing the landscape of implementations this way can help vendors who seek to know where they have a strong market presence and where they might want to ramp up their market strategies.
But is this approach, taken on its own, enough to understand which characteristics of institutions drive the selection of a given piece of technology? Might we be missing other factors that better explain why institutions select certain technologies? In this piece, we will explore these questions using a technique called “key driver analysis,” focusing specifically on the learning management system (LMS) implementations.
Methodology to Produce Key Driver Analysis
Before diving into our analysis, it might be helpful to understand our methodology. We began by selecting certain institutional classifications (institutional size, sector, etc.) from the Integrated Postsecondary Education Data System (IPEDS). From the same data set, we selected those institutional characteristics that we judged most relevant to institutional selections of learning management systems. These characteristics include percent of students enrolled in distance learning, instructional activity (clock/credit hours), and other technologies (learning analytics platforms, adaptive learning platforms, etc.). After combining these data with our proprietary implementation data, we deployed a key driver analysis across over 3,000 institutions to find the importance of certain variables (institutional size, instructional activity, etc.) in predicting which LMS an institution has implemented. Finally, for the sake of brevity, we restricted our analysis to those LMS’ that have over 1% market share.
Findings
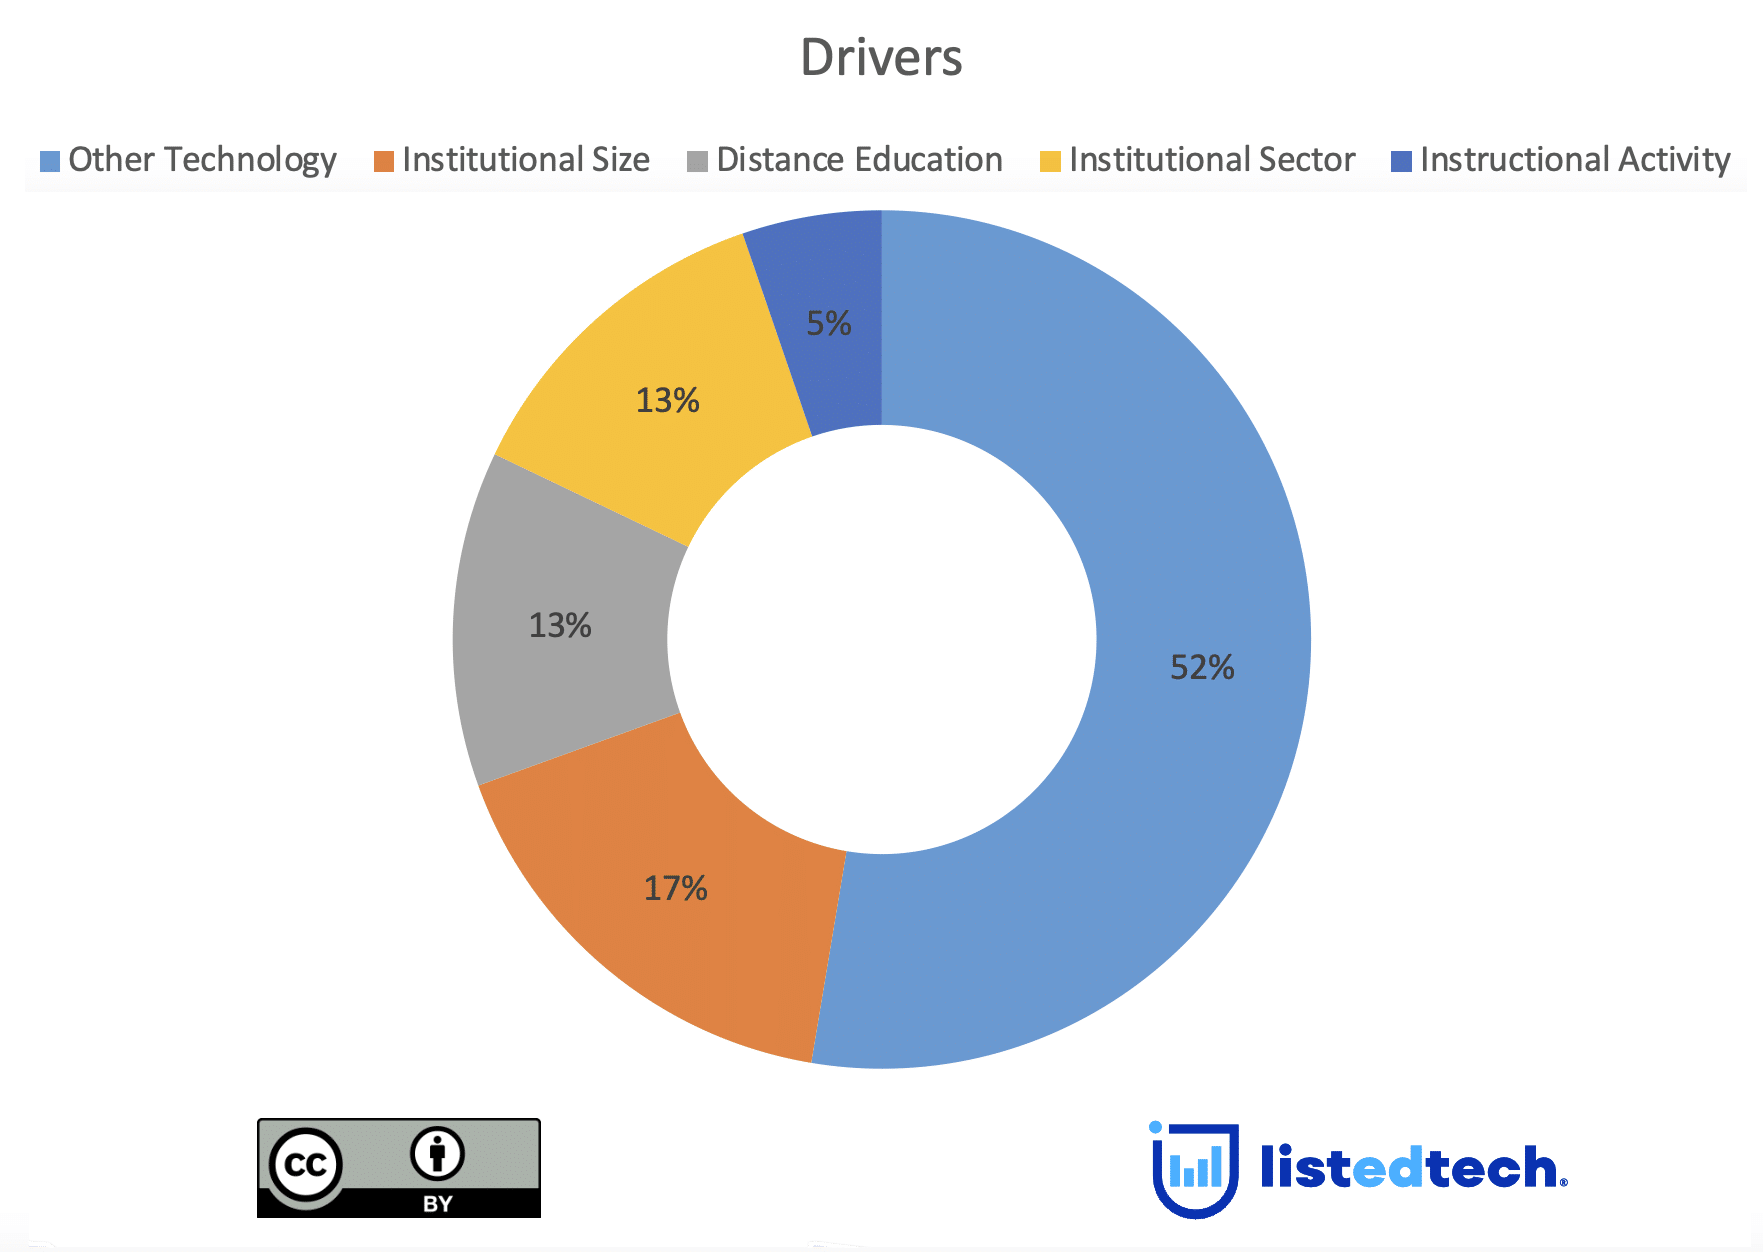
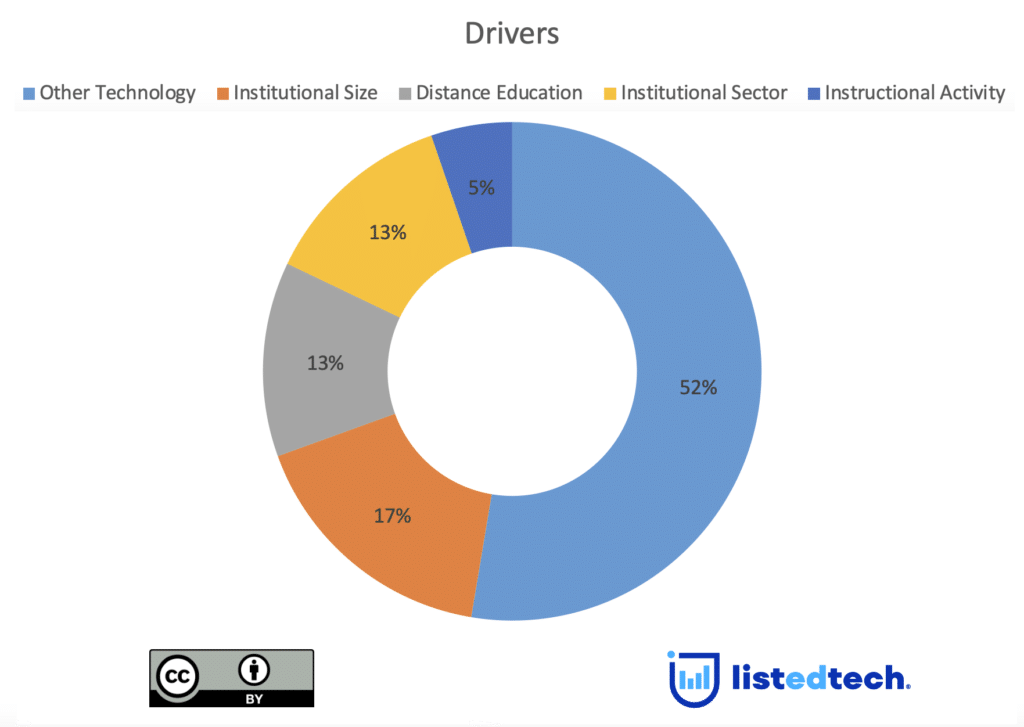
As shown in Figure 1, our analysis shows that the most significant driver in predicting which LMS an institution has implemented is another technology, followed by institutional size. For example, courseware solutions (Sophia Learning, etc.), assessment and evaluation solutions (AEFIS, etc.), and proctoring solutions (Examity, etc.) were the most common drivers of predicting which LMS an institution had implemented. However, despite appearing most commonly in approaches seeking to understand technology implementations, the institutional sector (public, two-year, etc.) was the third most common driver of predicting which LMS an institution had implemented, tied with the percentage of students studying remotely.
Looking at the drivers for each of the LMS highlighted in our analysis, it revealed that D2L’s Brightspace had the most drivers of all LMS and that the presences of other technologies, such as e-Portfolios learning analytics platforms in institutional ecosystems, were the strongest predictors of whether an institution had implemented Brightspace. Likewise, the strongest predictors of implementing Blackboard Learn included other technologies (learning analytics platforms) but also whether an institution leveraged a credit hour system and whether the institution was a public, two-year institution.
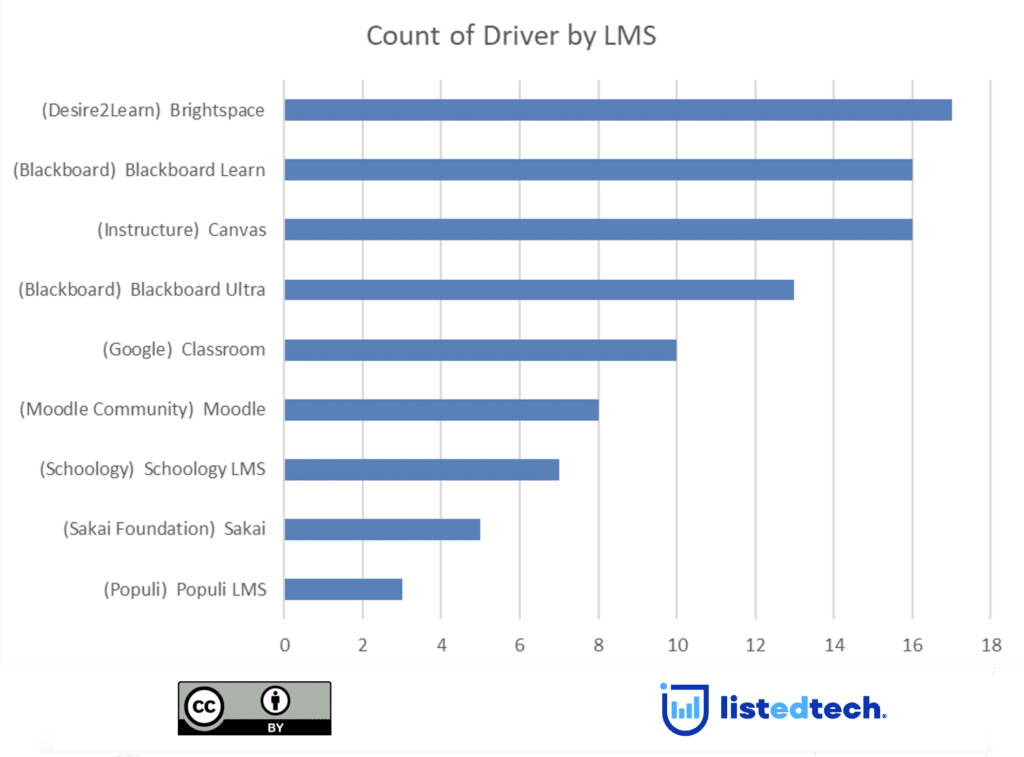
Why is this analysis critical? First, it reveals that looking at implementations through the lenses of the institutional sector and institutional size only tells half of the story of what drives selecting a specific technology. Getting a true sense of what drives the selection of a solution requires additional data, such as institutional characteristics and a deeper analytics approach. Also, through this type of analysis, institutional leaders can better isolate which solutions they should consider when their decisions include what technologies similar institutions have implemented. Lastly, by leveraging this analysis, vendors can precisely see their markets and provide more targeted market strategies.
Summary
Understanding institutional decision-making about technology is challenging, encompassing many factors (budgets, stakeholder interests, institutional goals, etc.). Likewise, many of these factors change over time due to extraordinary circumstances, such as the pandemic.
That said, while our analysis does not overcome all these challenges, it does provide additional insight into what drives the selection of technologies. Through our approach, institutional leaders and vendors have more insight into the conditions that play into which technology an institution may implement.
Finally, our analysis raises important questions about whether other characteristics are essential to predict the selection of technologies. For example, would the results of our study differ if we included retention and completion rates in the mix? Likewise, are some relevant drivers unavailable in national data sets like IPEDS, such as learning outcome data or student grades?
In future research, we will continue refining this approach to address these critical questions. We look forward to receiving feedback and presenting our findings over the next few months.
