The question of the value of postsecondary education has increasingly become top of mind for many people, especially given rising tuition costs and the impact of COVID-19 on college students. For example, the Gates Foundation and others have devoted much effort to defining “postsecondary value” and how institutional leaders might deploy strategies to improve it for their students.
These promising efforts suggest that we are a pivotal point in education reform. However, these efforts often overlook what role technology might play in helping institutions fulfill the promise of postsecondary value. For example, as institutional leaders spend millions of dollars implementing technology, might we miss a chance to explore which technologies are more helpful in promoting postsecondary value?
This piece will explore this question using a “key driver analysis,” focusing on one metric of postsecondary value, i.e., graduation rate.
Methodology
Before diving into our analysis, we should first understand key driver analysis. Simply put, key driver analysis quantifies the relative importance of a series of predictor variables in predicting an outcome variable. Called “drivers,” these predictor variables can help organizations answer questions such as how to improve the preference for a given brand, how to increase net promoter scores (NPS), or how to boost customer satisfaction with a given service (call center, for example).
Our analysis focuses on the technology drivers for graduation rates (150% of normal time to completion) in just under 3,700 four-year and less-than-four-year US higher education institutions. For our analysis, we leveraged our implementation data and yearly graduation rates for each institution from the Integrated Postsecondary Education Data System (IPEDS) from 2011 to 2021, the last full year of available data. Finally, we only included technology categories that significantly correlate with graduation rates to make the analysis more efficient.
Findings
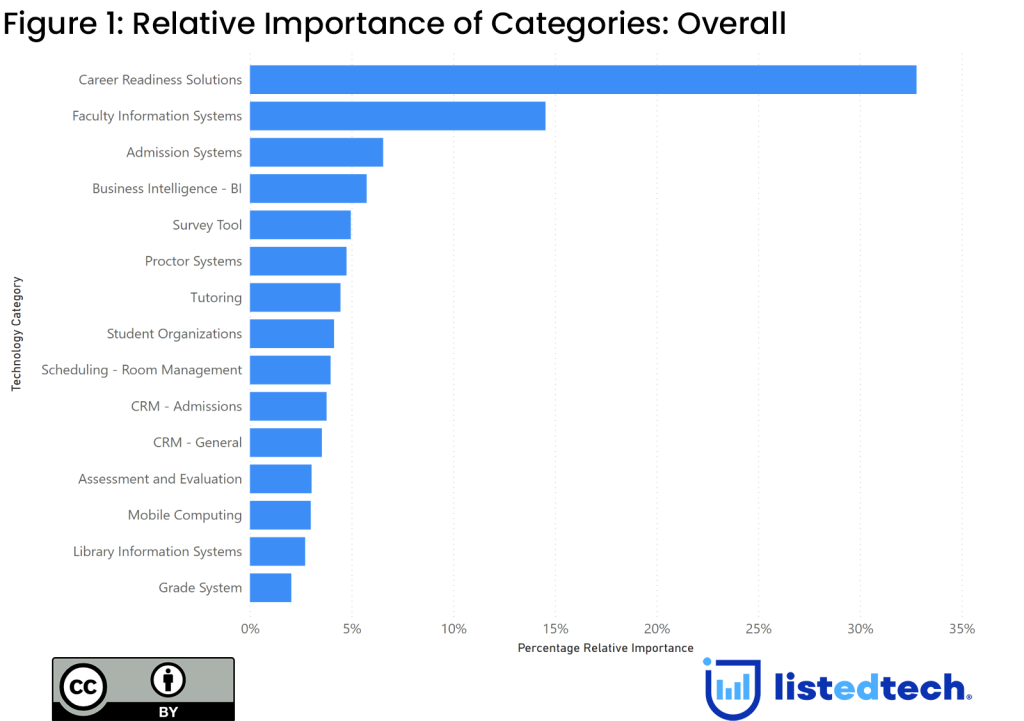
Figure 1 shows the output of our analysis for all institutions in our data set. The Career Readiness Solutions category shows the most relative predictive power of graduation rates than other categories, more than double that of the following category (Faculty Information Systems). Likewise, the Retention Management Category does not appear to demonstrate any significant relative predictive power, which is surprising as products in this category aim to help institutional leaders prevent students from ending their student journeys before graduation at their institutions.
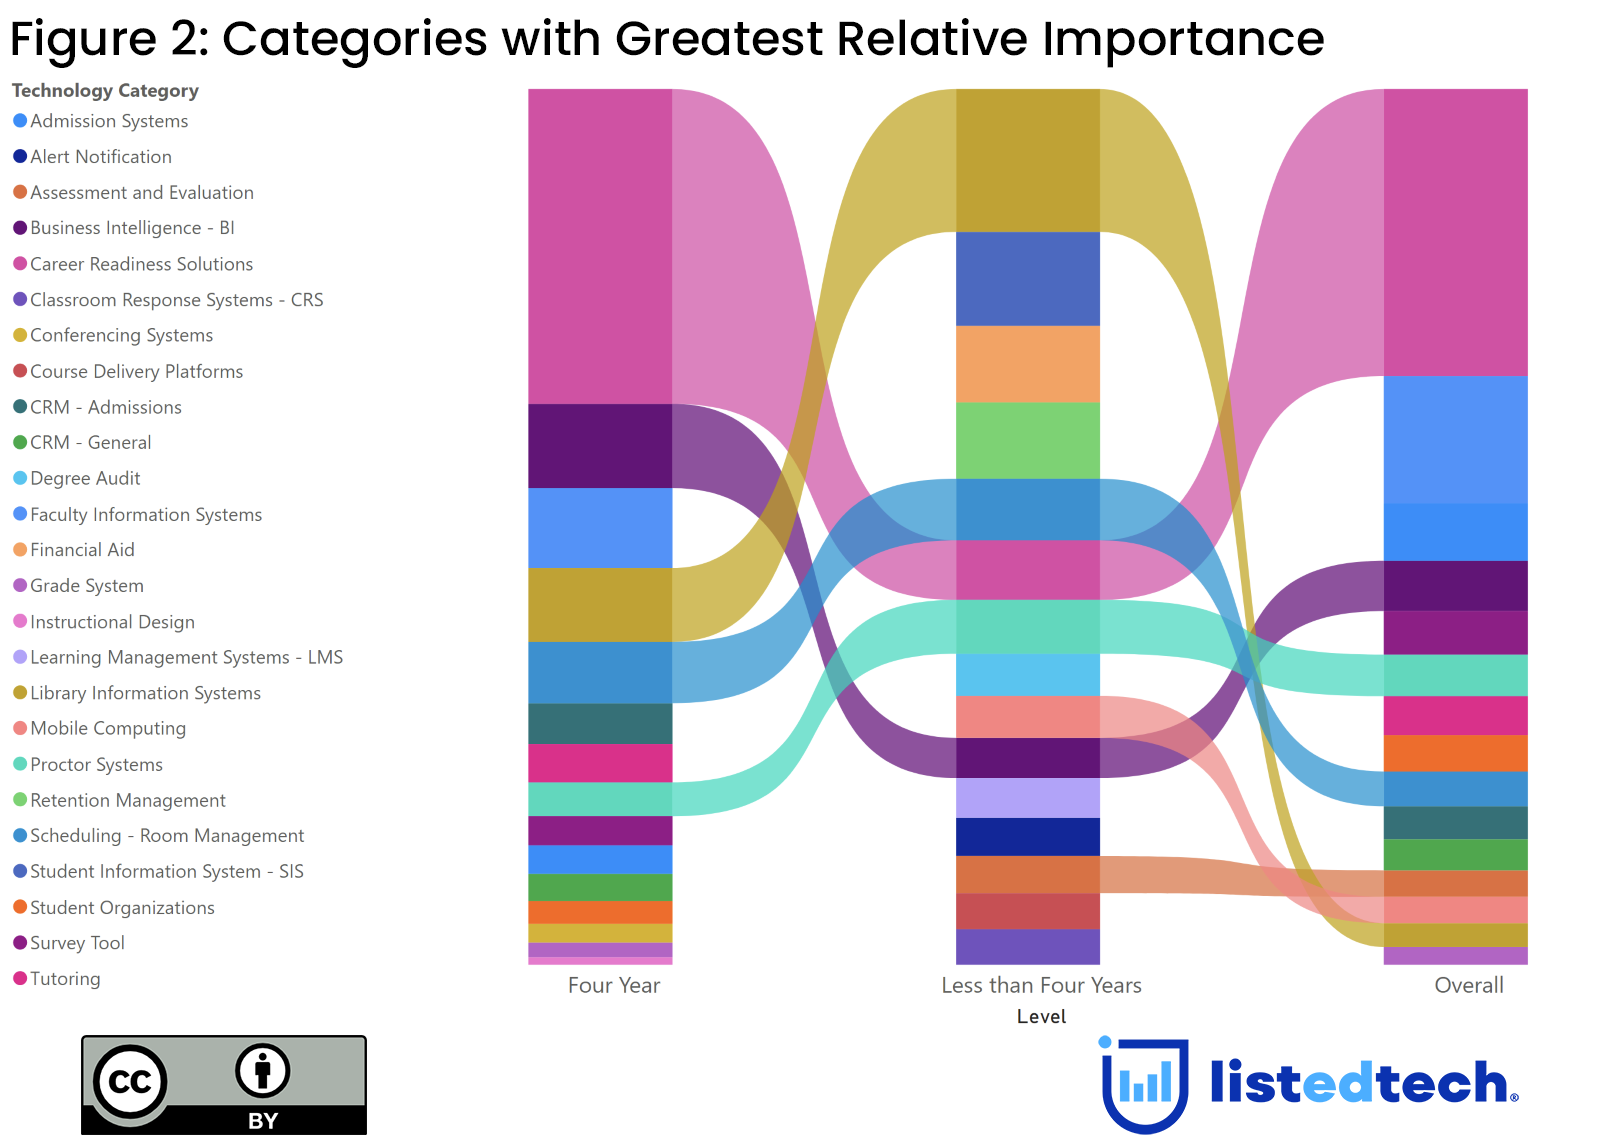
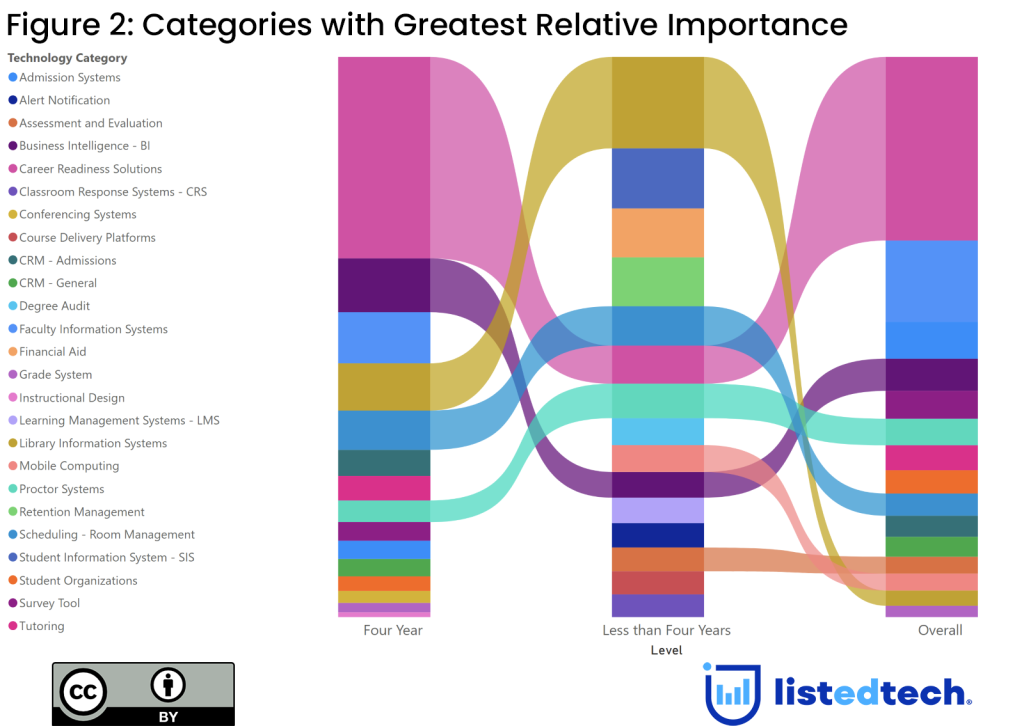
However, viewing the findings by the institutional levels IPEDS uses to compare graduation rates (four-year and less-than four-year) reveals a richer picture. Figure 2 shows that, while Career Readiness Solutions show the highest relative predictive power overall and in four-year institutions, Library Information Systems is the highest in less than four-year institutions. Also, the Student Information Systems category, which did not show any relative predictive power overall and in four-year institutions, comes in second in relative predictive power in less than four-year institutions.
What does this all mean? First, it suggests that the institutions that focus on implementing technology that helps students see that they are ready for the job market are more likely to have improved completion rates, as evidenced by the Career Readiness Solutions category showing significant relative predictive power overall and in each level. Likewise, our findings indicate that categories that one would expect to drive graduation rates (Retention Management Solutions, Advising and Degree Audit Solutions, etc.) do not show any relative predictive power at all in influencing graduation rates.
Finally, we should note that our analysis does not account for how technologies might show more relative predictive power in concert than alone. Further investigation might reveal, for example, that the products within the Retention Management Solution category, joined with those in the Advising and Degree Audit Solutions category, show greater relative predictive power than each alone. Also, our findings may be very different if we considered products as drivers and not categories, which may reveal that, despite the overall category showing no relative predictive power, specific products within that category do.
Summary
Understanding the inputs and drivers of postsecondary value is essential, as it can help institutional leaders gain insight into how to deliver that value to their students and improve their chances of success after graduation. Yet concentrating on efforts such as creating clearer academic pathways or improving advising support alone obfuscates the role technology might play in driving postsecondary value. Without viewing all the possible influencers of postsecondary value metrics (graduation rates, etc.), we risk presenting an incomplete set of strategies for improving postsecondary value to institutional leaders and not wholly fulfilling the promise of reforming higher education.