Since 2011, some 550 four-year public and private non-profit institutions, slightly more than 20% of the entire U.S. market, implemented at least one of the admission CRMs.
These solutions have become increasingly common, especially with an ever-growing emphasis on enrollment and the need to modernize and operationalize complex enrollment management processes.
As billed by the solutions themselves, admission customer relationship management systems have many primary functions, such as:
- improve student communications and engagement
- better segment and define the target market of prospective students
- manage events
- facilitate data analysis and management, and
- integrate with your existing solutions
Some providers note that their solutions will help institutions recruit more students. The focus on student recruitment is precisely what we look at in this post.
Before diving into the topic, it is essential to note that the continuous theme of mapping IPEDS data to technology implementations should be considered exploratory. We experiment with available data to identify new trends. There are many forces impacting outcomes and there are caveats within this analysis that matter a great deal, both at institutional and macro levels. But the thinking going into it is straightforward: measuring outcomes is crucial, and we should find new ways to do so, especially when it comes to expensive, mission-critical technology decisions.
Analyzing Admission CRMs Data
The data reviewed herein look at implementations of admission CRMs occurring between 2014 and 2017. We pivot our analysis around five solutions within the product category that had the most implementations within this period:
- Slate by Technolutions
- CRM Recruit by Ellucian
- Target X CRM
- Student Search by Fire Engine Red
- Radius by Anthology (formerly Hobsons)
From there, we used IPEDS data and mapped the percent change in enrollment two years after the implementation year to each institution to understand how enrollment has shifted since the implementation. For example, Public University A implemented Slate in 2016. Considering the first-time undergraduate enrollment for Fall 2016, we calculated the percentage change from Fall 2016 to Fall 2018. To create our visualization, we have performed these calculations for all implementations. We looked at the aggregate result and reported the median and average change in enrollment for each of the solutions reviewed.
We used this specific student category to focus on a set of students most likely to be traditional-aged undergraduates, a population whose enrollment is often the responsibility of a centralized administrative function group and the primary stakeholder in acquiring/selecting and utilizing the admission CRM. By contrast, enrollment management for graduate students is messier, less centralized, and more frequently and widely outsourced.
The Findings
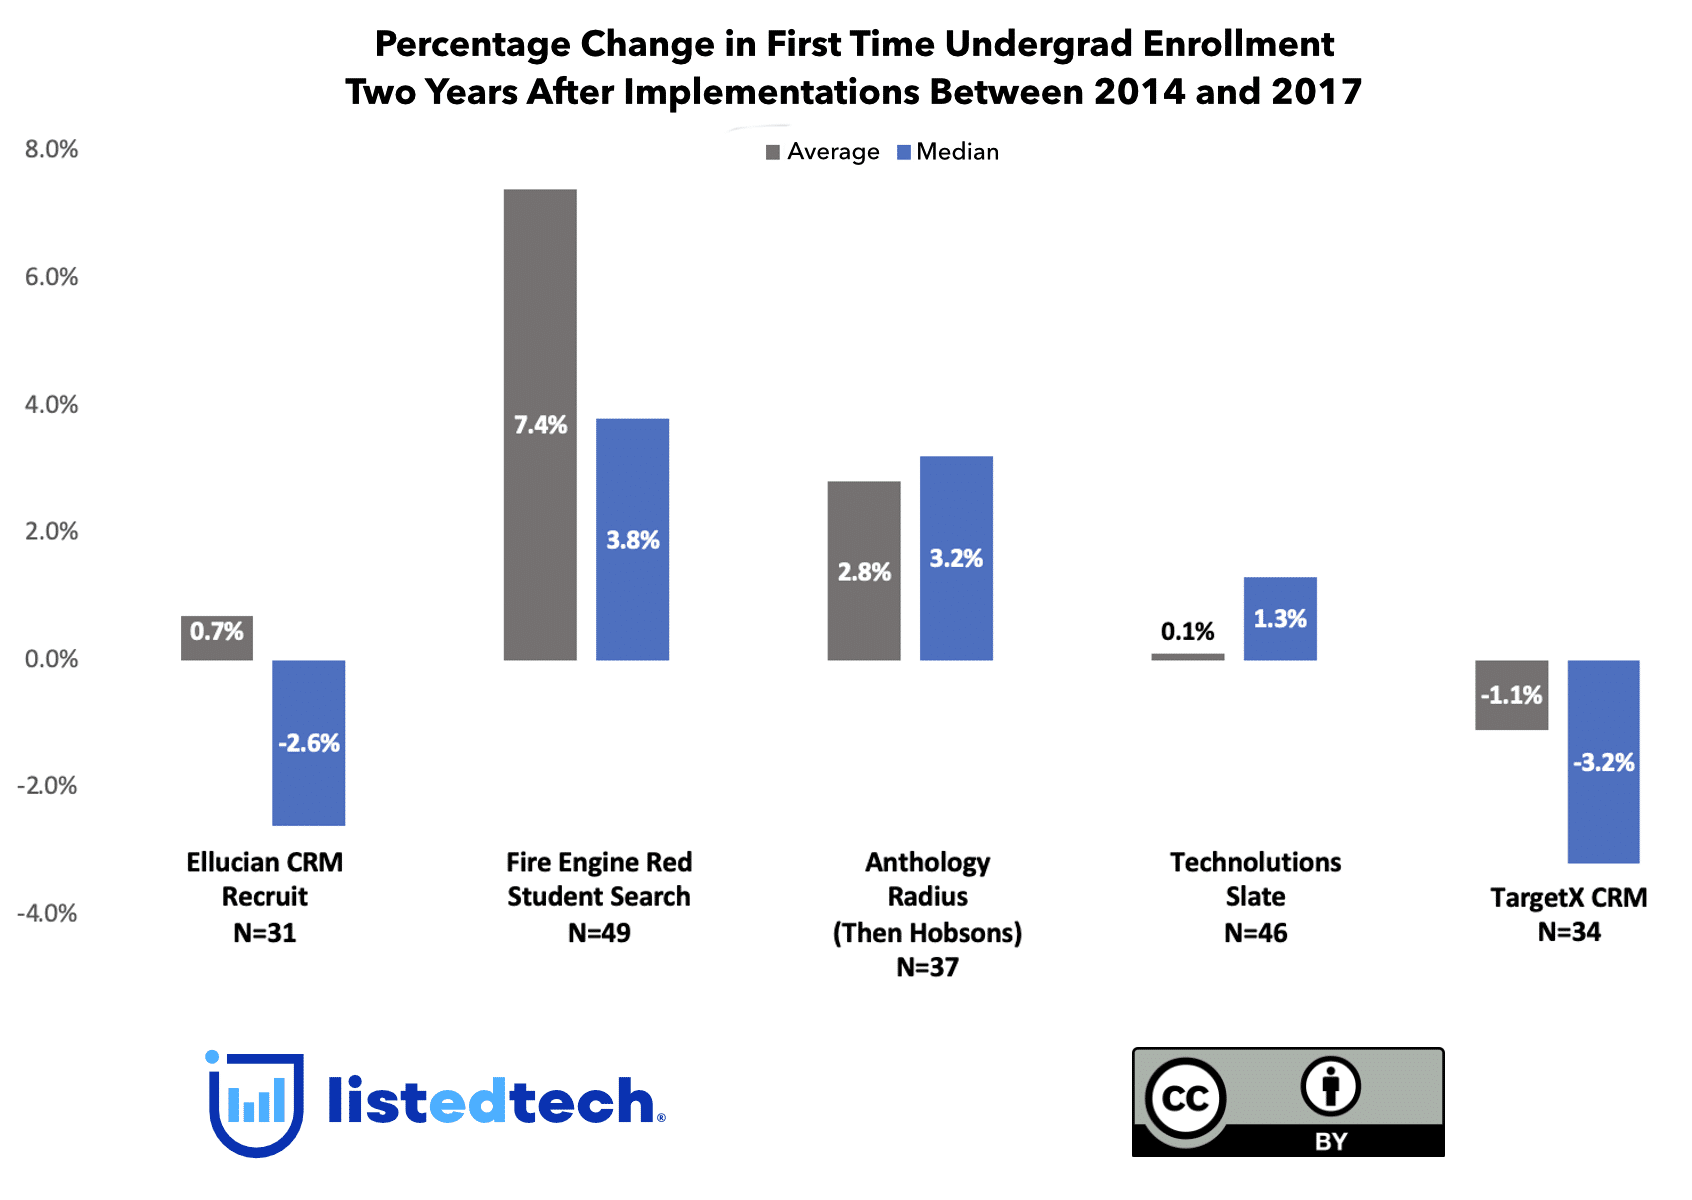
The graphic below shows that the collective set of institutions using each solution have fared quite differently. Within our analysis period, institutions that deployed Fire Engine Red’s Student Search, which is used by a wide variety of institutions (from Oregon State to Colgate), collectively showed the largest average and median growth, 7.4% and 3.8%, respectively. Radius users, then a Hobsons company and now a part of the Anthology family, also coped well with an average gain of 2.8% and a median gain of 3.2% over the measured period.

On the opposite side, TargetX CRM schools collectively struggled the most. Of important note, during this period, TargetX partnered with several regional, smaller state university campuses that were undoubtedly impacted by the macro-level enrollment headwinds. Many, if not most, of these schools faced them and continue to encounter them even more so today. A number of their partners did see enrollment growth after implementation.
For admission CRMs, we can measure enrollment, as an aligned outcome, in many ways, given federal reporting requirements. But what else might these and other solutions impact?
Searching for Outcomes
This post is about recruiting students and the first line of technology institutions use, admission CRMs. It also aims to highlight a piece of a larger puzzle: outcomes measurement. For admission CRMs and other technologies, we should seek to understand where else they make a measurable impact, such as student success metrics like retention or more granular enrollment management variables within different parts of “the funnel,” like summer melt. If they improve operations, how and where does that shine through?
We often see results measured in glossy case studies of one or two select institutions. Product-level implementation data allows for a wider-scale assessment of outcomes across institutions, and it can lead to asking different, essential questions of vendors and institutions alike. Can these findings help vendors differentiate themselves or inform product development? Can they help institutions make better decisions in their technology acquisitions? Most importantly, can they help schools better serve their students, however “better” is defined (and it should be).


