The article is cross-posted at e-Literate
One of the trends we have been covering is the gradual consolidation of global LMS markets in higher education around “the Big Four”, Moodle, Blackboard, Canvas, and D2L Brightspace. While there are marked similarities in terms of this consolidation along with the broader move to the cloud, it would be a mistake to view various global regions as having the same trends overall, even in a subset of English-speaking countries.
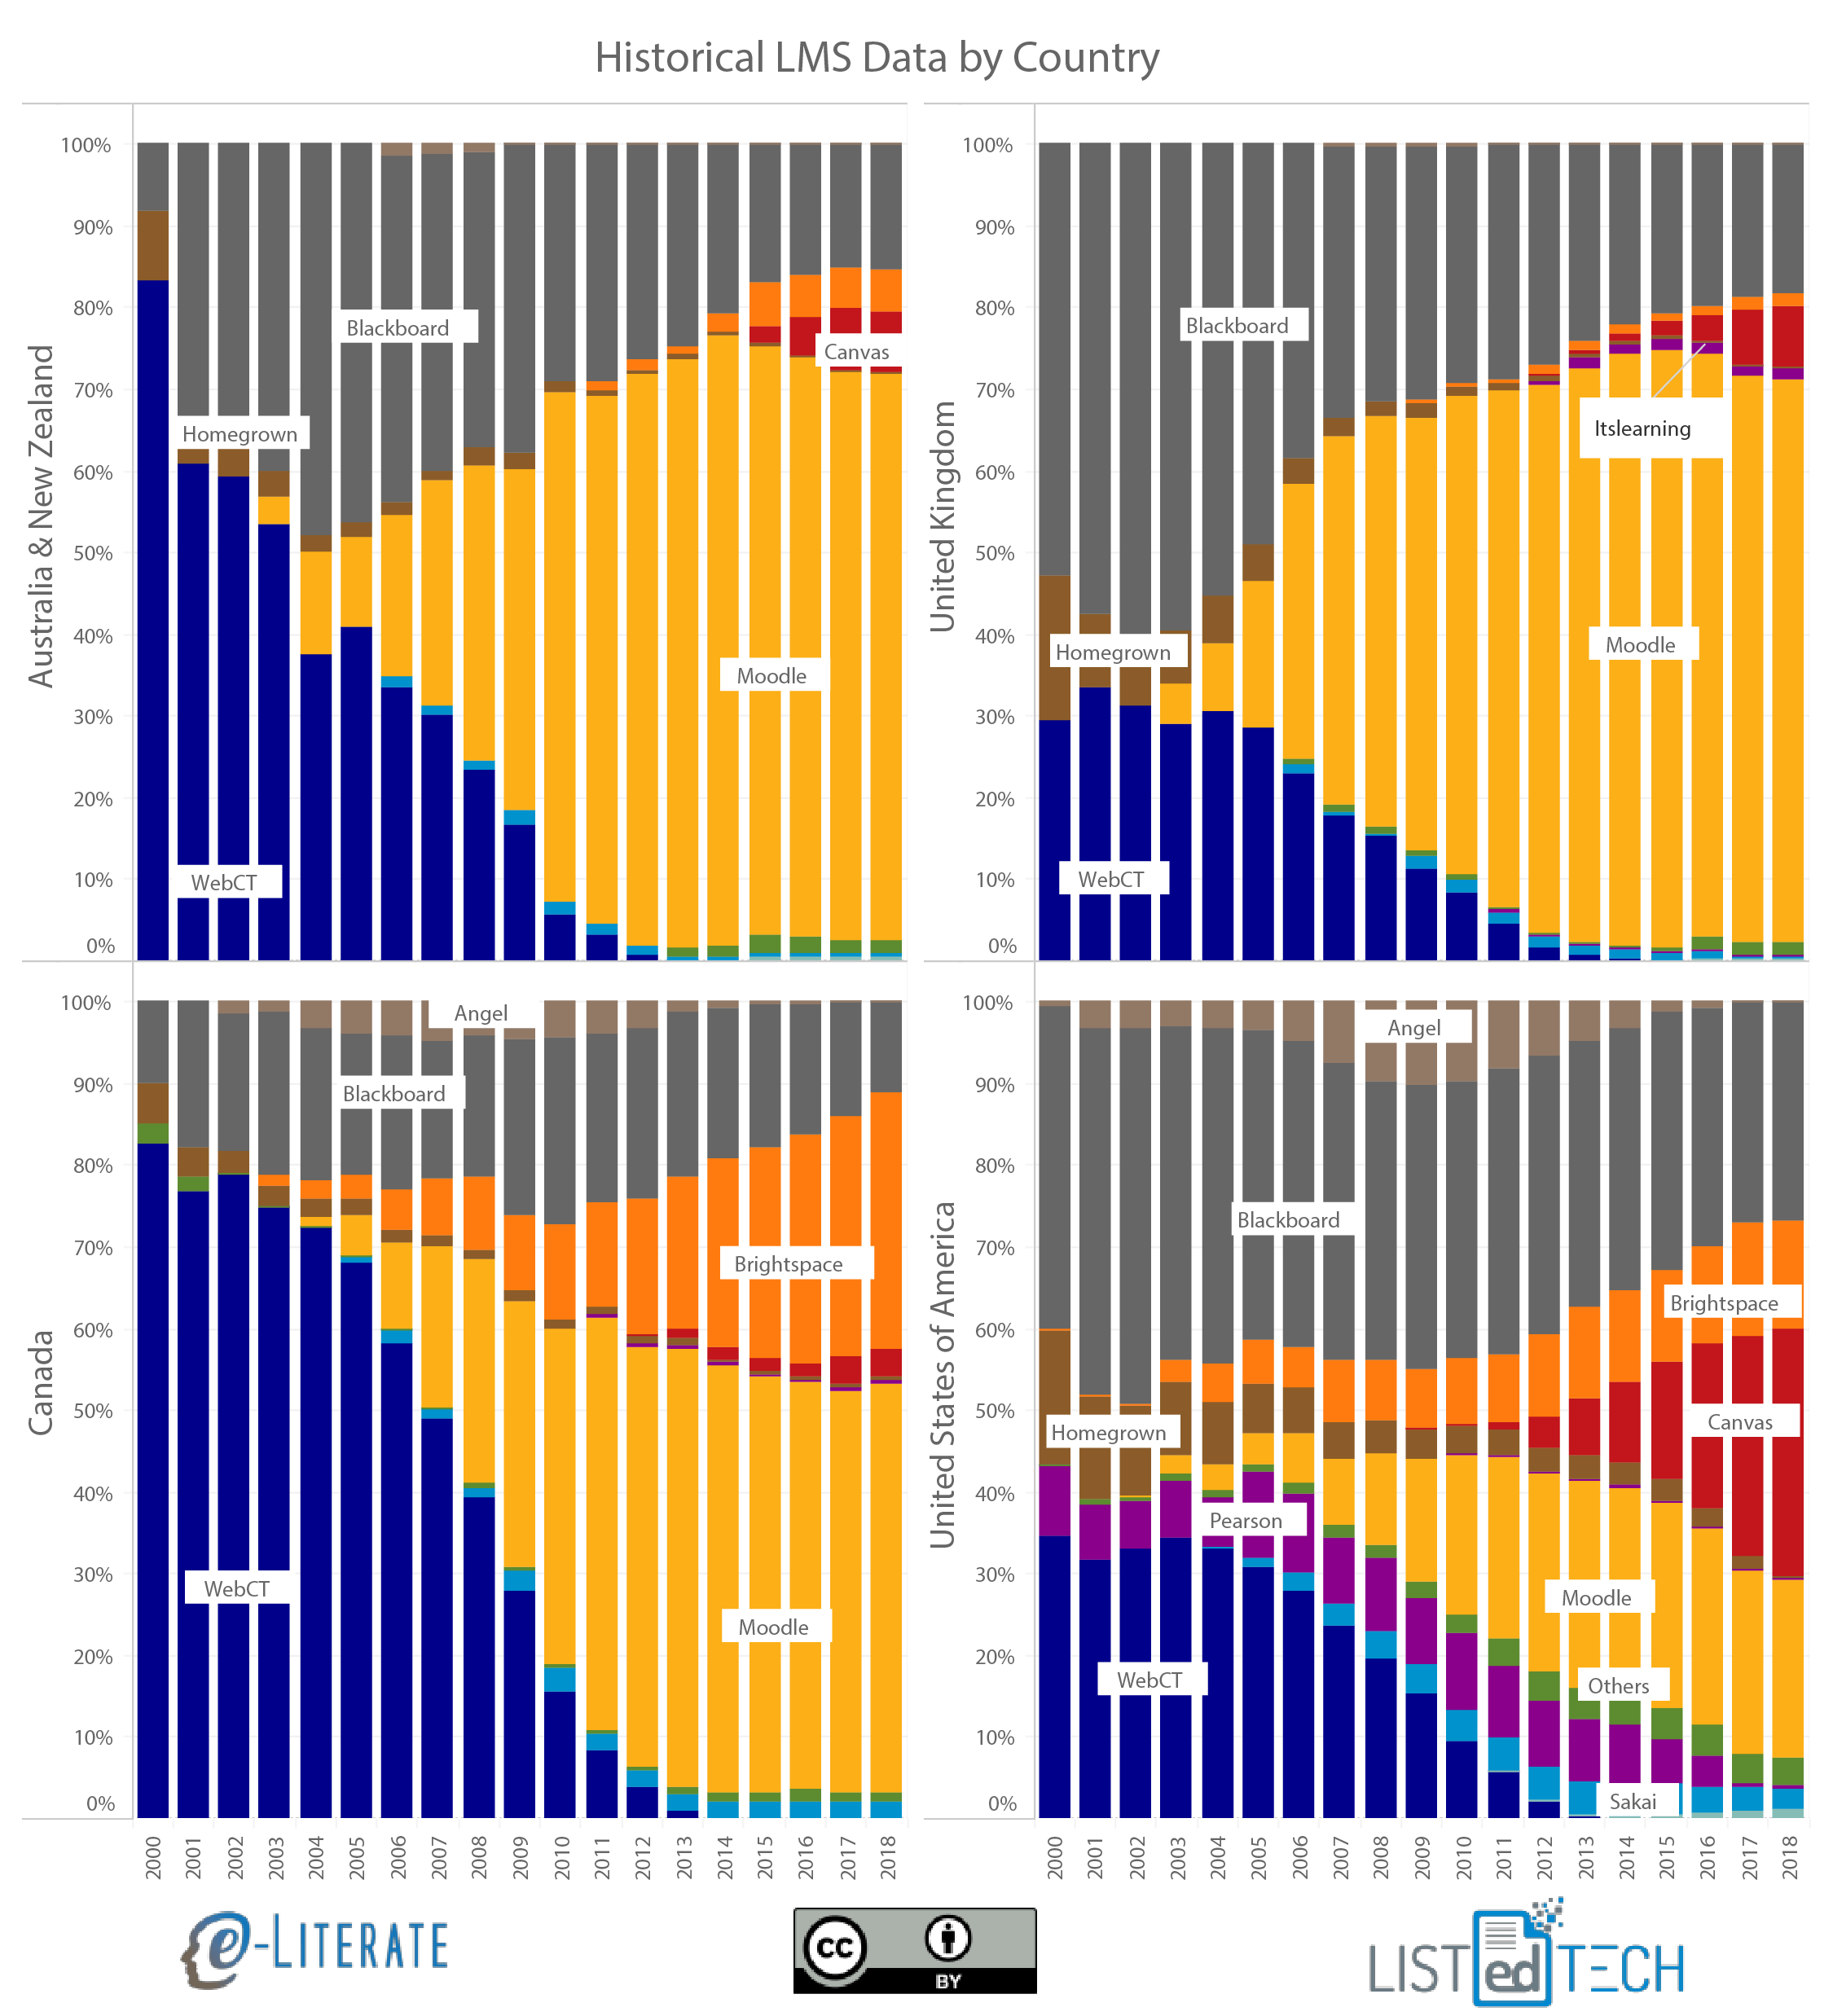
By taking a step back and looking at institutional market share per country per year (i.e. the percentage of higher education institutions having a particular LMS as their primary system), different adoption patterns become more apparent. In this case, we’re looking at Australia, the United Kingdom, the US, and Canada. Note ahead of time that Blackboard acquired WebCT in 2004 and ANGEL in 2009 – this view separates out the product lines regardless of ownership, thus “Blackboard” means “Blackboard Learn / Academics Suite”. Also, note that this is just one subset of the global market intended to show different patterns.

While the very early market was practically a duopoly, the preference for WebCT vs. Blackboard varied significantly.
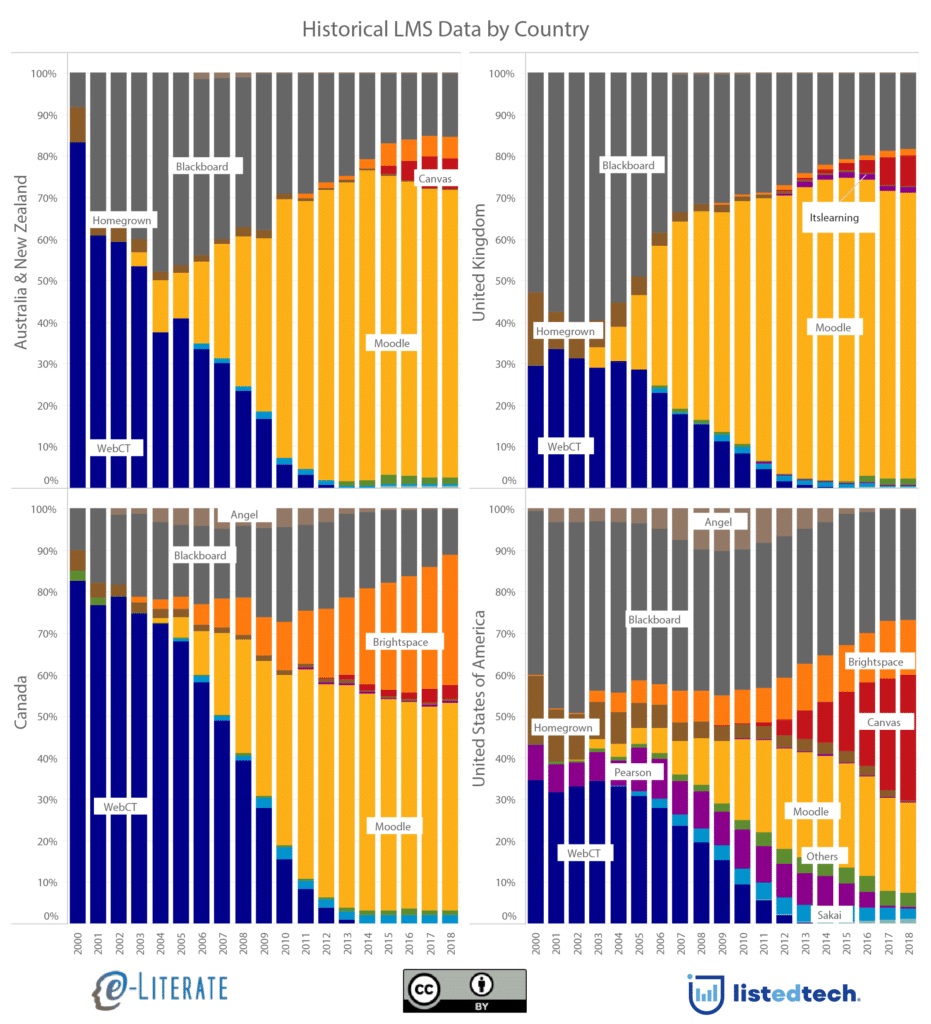
Australia and New Zealand have a rich history of homegrown LMS development, including CECIL (University of Auckland in New Zealand), which some argue was the very first web-based LMS. There was still quite a bit of Homegrown LMS activity in the early 2000s along with a strong early preference for WebCT over Blackboard. Australia is the home country for Moodle (Perth), yet it lagged the UK in terms of late 2000s adoption of that system.
The UK showed a preference for Blackboard over WebCT, while also having significant Homegrown LMS adoptions early in the 2000s. Starting in 2003 we see the most rapid shift towards Moodle of any of these four countries, followed by a more recent move towards Canvas starting in 2013, starting with the Birmingham University adoption.
Canada is the home country for both WebCT (Vancouver, British Columbia) and D2L Brightspace (Kitchener, Ontario), and accordingly, we see the highest percentages for both systems. This country also shows the slowest market gains for Canvas compared to the other three. Overall, early in the market, Homegrown solutions were much more common.
The US – home country to Blackboard, Pearson, Canvas, and Sakai – is seen as an outlier by not having Moodle as the dominant system in terms of installed base. Pearson LearningStudio, formerly eCollege, was quite important in the US market, largely due to its position in the for-profit sector. And this is the leading country in terms of Canvas installed base and growth.
There are other patterns to see in the data, but the overall point is to note how different adoption patterns can be in the LMS market, even for a subset of English-speaking countries since 2000.
Update 27 Nov: We have duplicated the x axis to show on both levels for clarify. The data is based on the number of institutions and represent running totals of active implementations where we have implementation / decommission dates – approximately 75% of all known active systems. The current totals used for each country are approximately 200 for Australia, 250 for Canada, 700 for the UK, and 3,500 for the US.
Update 30 Nov: In an embarrassing mistake I credited CECIL to Australia when it was based at the University of Auckland in New Zealand. We have since updated the graphic to include both countries combined and edited the description of that region’s Homegrown activity. The article now combines Australia and New Zealand and treats as one country for the purposes of this analysis.


