We usually present the market share for the product categories using the number of institutions. This is currently our default view. However, this way of presenting does not tell everything, and stakeholders should have access to other metrics when making product selections. This post compares market share by the number of institutions and enrollment to showcase the differences.
Two main reasons can explain why looking at student enrollment can be a more accurate measure :
First, higher education institutions vary widely in size, with some having only a few hundred students and others having tens of thousands. Therefore, looking at the number of institutions alone can be misleading because it does not reflect the size of those institutions or the number of students they serve. It’s like comparing single-campus institutions to multiple-city universities.
Second, student enrollment can become a vital metric when we dig into a product category and would like to compare solutions. By using enrollment, schools can better understand the market penetration of Product A in smaller institutions compared to Product B. As contracts are often based on the number of students, stakeholders have the capacity to comprehend the logic of contract pricing with enrollment in mind.
Market Share Side-by-Side Examples
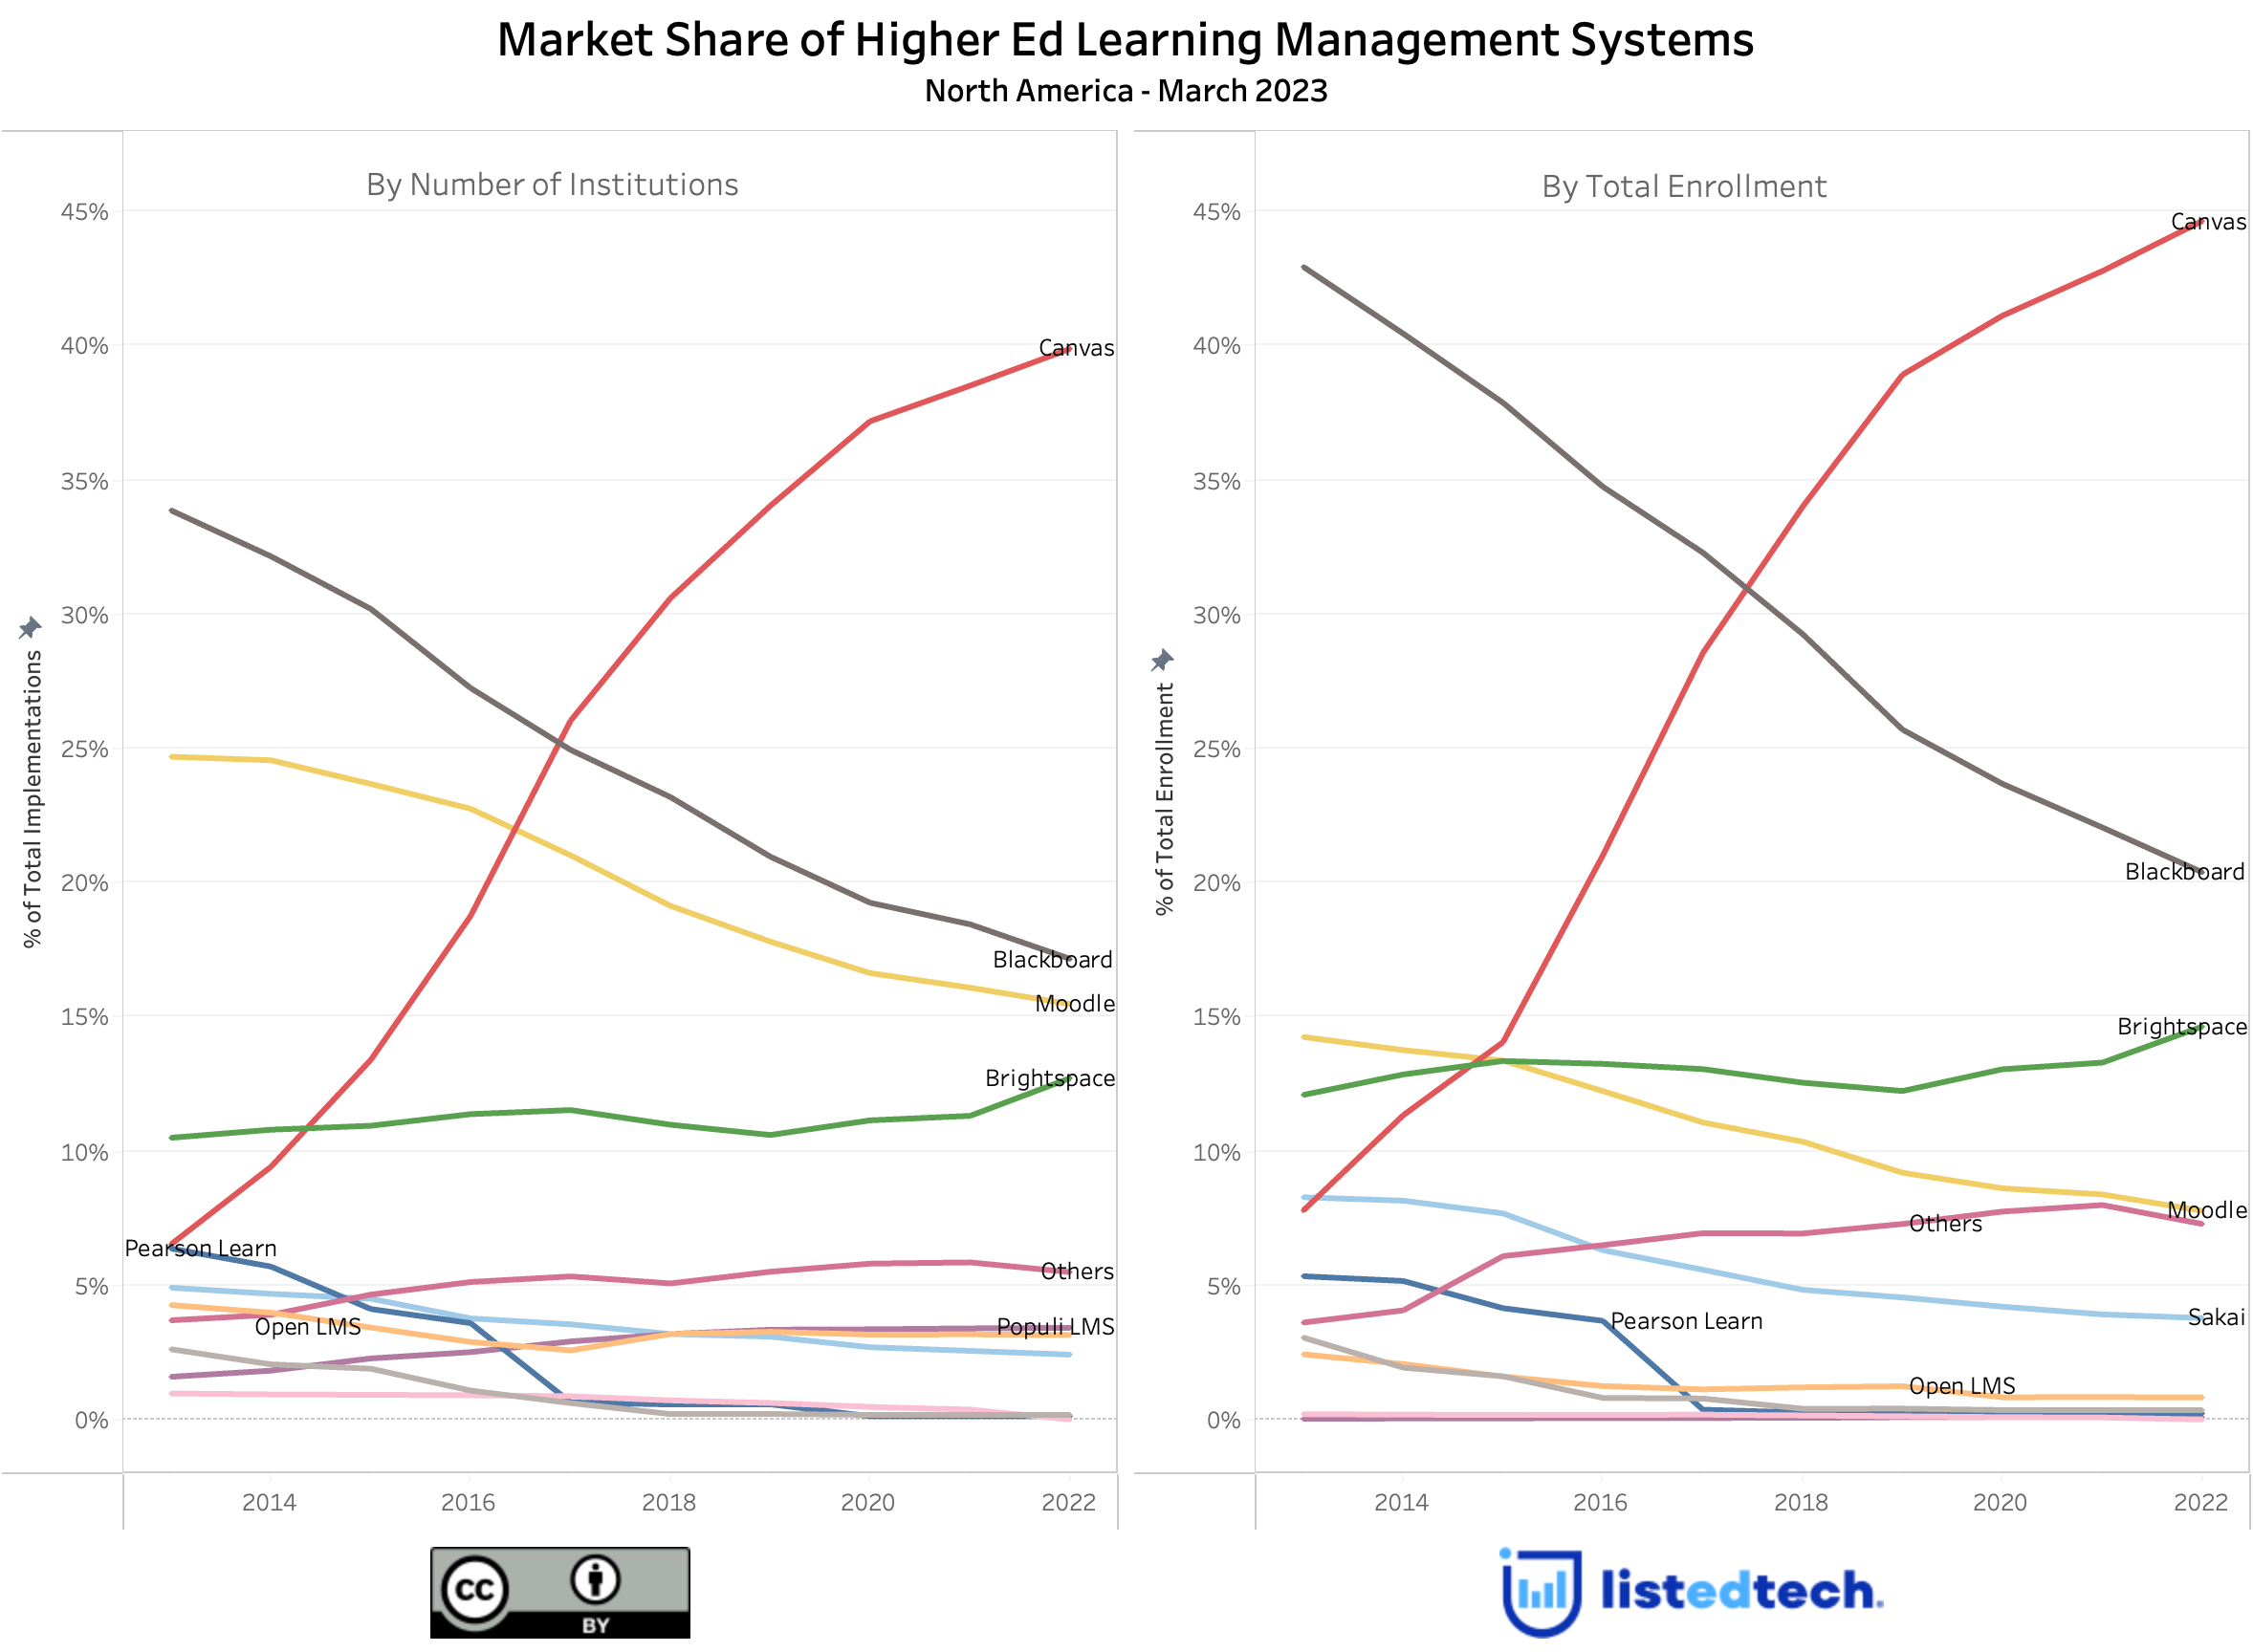
Many ListEdTech clients requested this dual view. On the left side, we have our default view: the one we currently see in our portal (although the portal showcases 2023 data).
Some observations for the LMS HigherEd market:
- When considering enrollment, Canvas has 5% more market share, a similar trend to Blackboard (+3%).
- However, Moodle tumbles by 8% from the number of institutions to student enrollment.
- Brightspace and Sakai have a balanced market share on both sides of the graph. The enrollment view only advantages them by 1-2%.
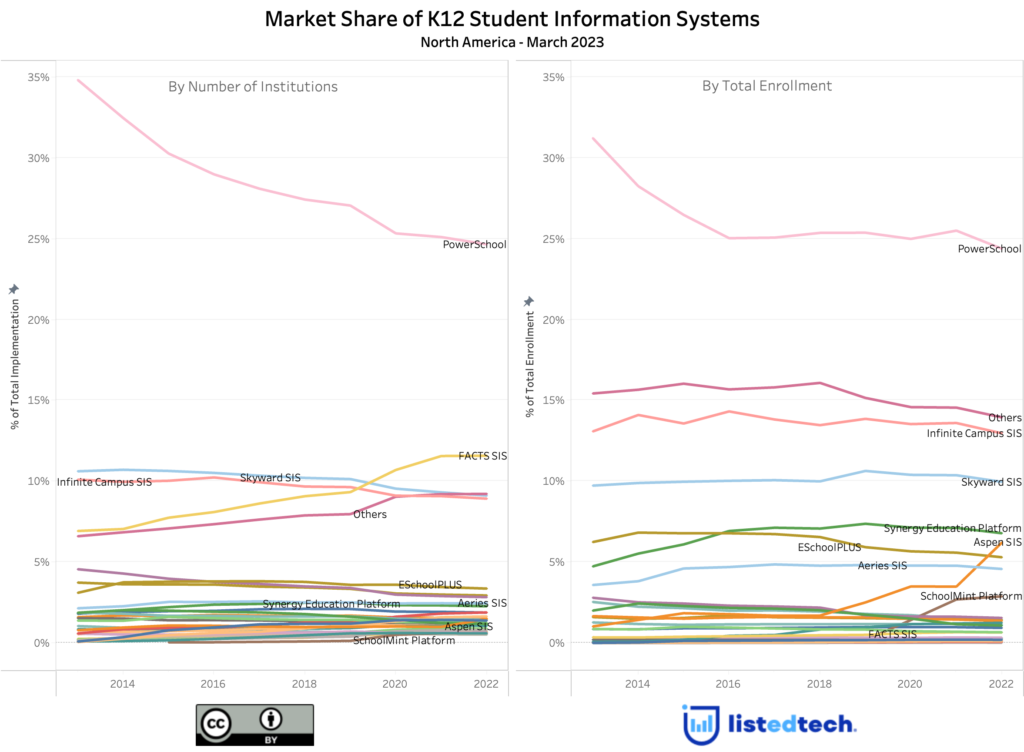
SIS observations
- Although PowerSchool has seen a decrease in market share in the past decade, the decline curve does not have the same plot on this dual view. When looking at the number of institutions, it looks like PowerSchool’s market share steadily decreased when the enrollment view shows a huge drop from 2013 to 2016 and has been pretty stable since then.
- From a mere 1% on the left graph, AspenSIS hits 6% when we look at the market share by enrollment.
- Skyward SIS represents about 10% of the K-12 SIS market share on each graph.
- From the institution’s view, FACTS SIS is alone in the second position, getting 12%. When looking at the enrollment view, it is among the 0-1% group with so many other solutions. Like Populi in the HigherEd market, FACT SIS succeeds with smaller schools and school districts.
When considering the market share of a product in education, looking at the dual view of the number of institutions and enrollment could provide a more representative view. We are happy to announce that we will implement this view in our portal over the summer, among many other changes.