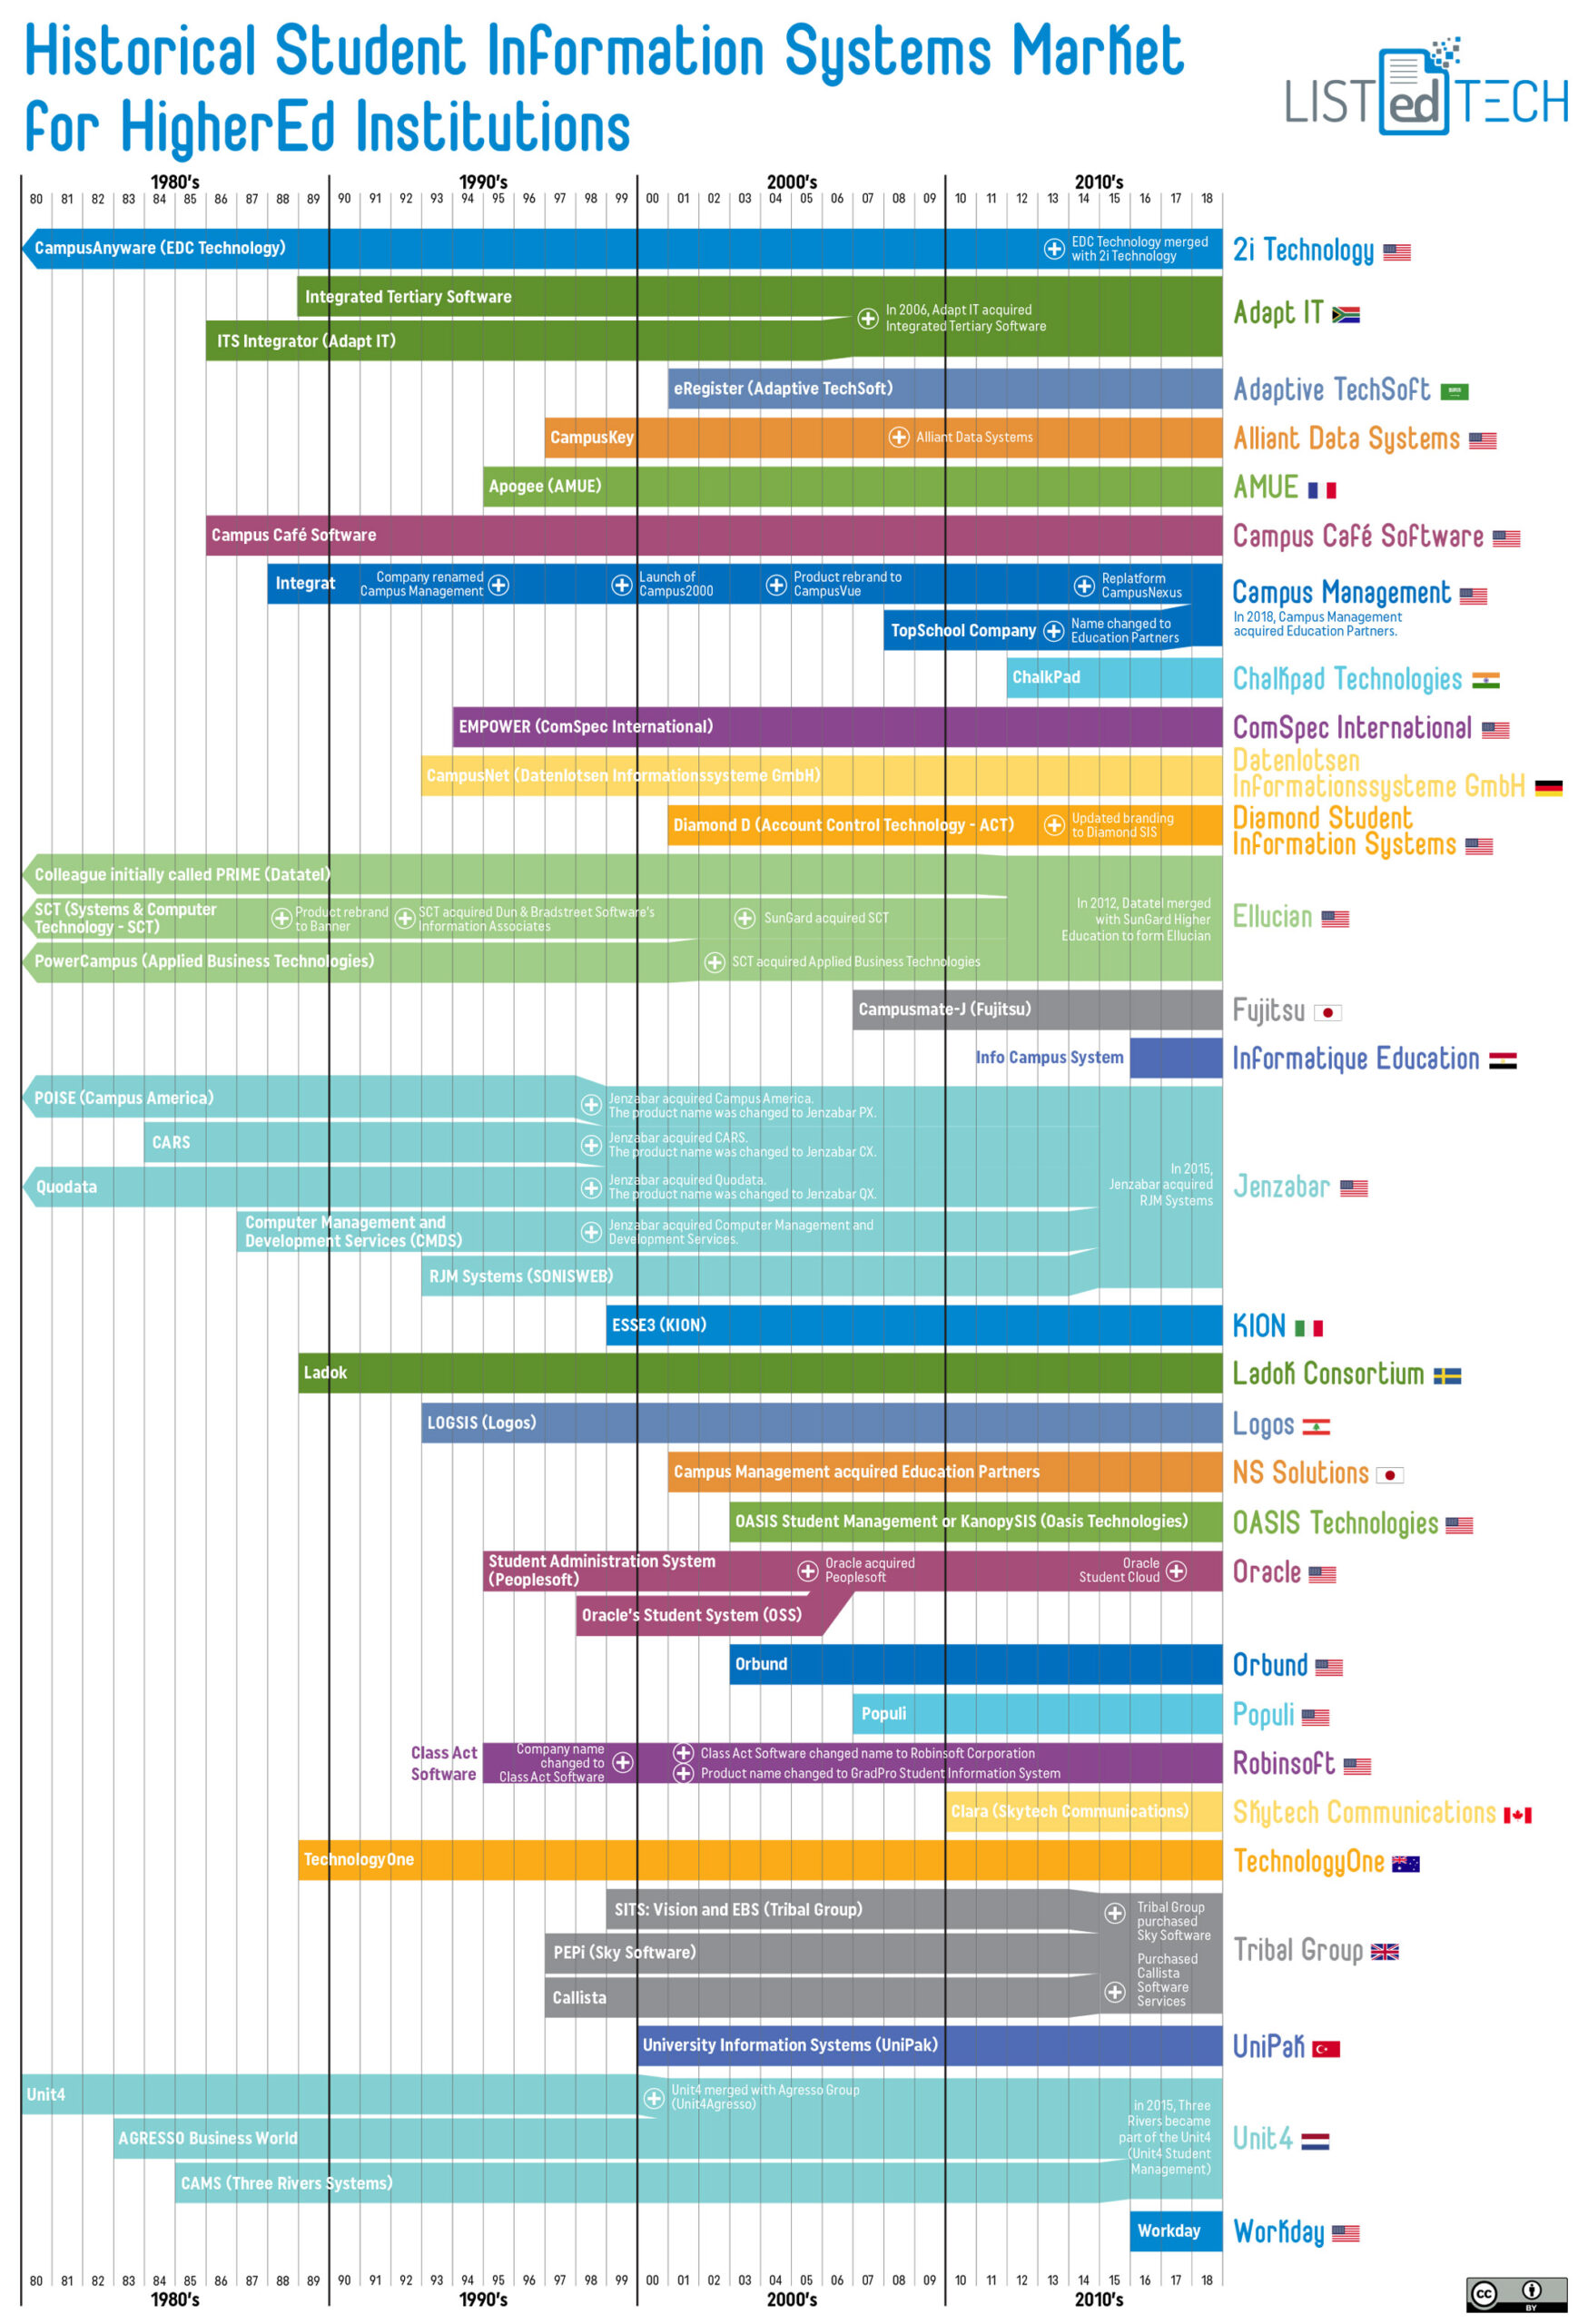
We are happy to present the first version of this historical Student Information Systems graph. We would like to thank several industry experts who took the time to help us with the creation of the graph.
We know (and hope) that many of you will send updates and comments. Since this graph wants to be as geographically inclusive as possible, please share with us any suggestions or additions, even if they only target a continent or sub-region.
Please note that this graph does not include very small systems (those that have less than ten clients) as well as systems that target K-12 institutions. This image does not show market share, just historical mergers or acquisitions.
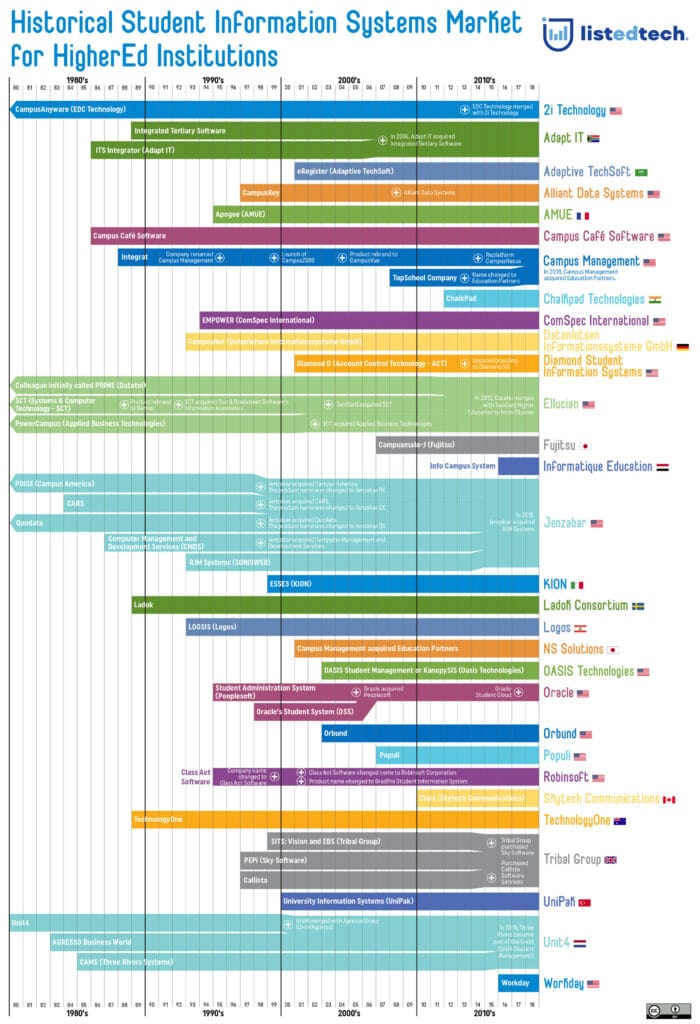
A printable two-page version of this graph can be found at the bottom of this post.
Please share among your network!


