Technology implementations related to teaching and learning in US K-12 school districts increased during the pandemic, with a combined annual growth rate (CAGR) of 21% between 2019 and 2021. Every technology category increased over this period, with Conferencing Systems (105%), Assessment and Evaluation Solutions (22%), E-Learning Solutions (18%), and Learning Management Systems (19%) showing the highest growth. In isolation, this view might lead us to assert that remote learning profoundly impacted US K-12 technology ecosystems, which may lead to a sea change in how teachers and students leverage digital tools in the classroom. Yet, further analysis of implementation trends suggests more to the story.
Methodology
We analyzed data for about eleven thousand US K-12 school districts – public and private – to determine net-new implementations for technology implementations within the teaching and learning ecosystem. We then used a time series clustering approach, which organizes trend data points over time into groups based on their similarities.
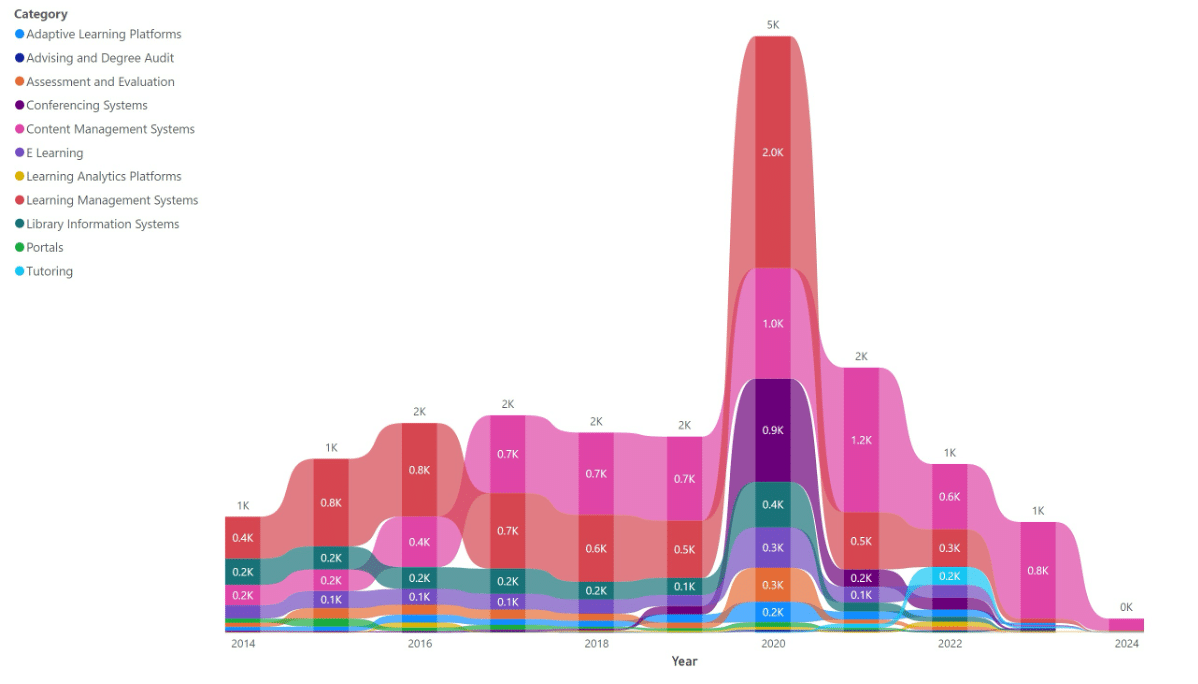
For example, Figure 1 looks at the overall implementation trends for these technologies over the past ten years and their relative rankings.
Source: ListEdTech
This figure shows that overall implementations doubled during the pandemic, from just under 2,000 implementations in 2019 to just over 5,100 implementations in 2020. Likewise, this figure suggests that K-12 leaders have looked to adopt more learning management systems, content management systems, and conferencing systems than other technologies during the same period.
Findings
Our analysis yielded two clusters, the first shown in Figure 2. Comprising nine thousand school districts (81% of which are public), this cluster mirrors the pattern shown in the previous figure, with an overall spike in implementations in 2020 and adoption of the same three categories. However, this cluster differs from the overall pattern in its combined annual growth rates between 2019 and 2021. For example, the CAGR for this cluster is four percent higher (25%) than that of the overall pattern (21%), and implementations in all categories grew faster during this period than categories overall.
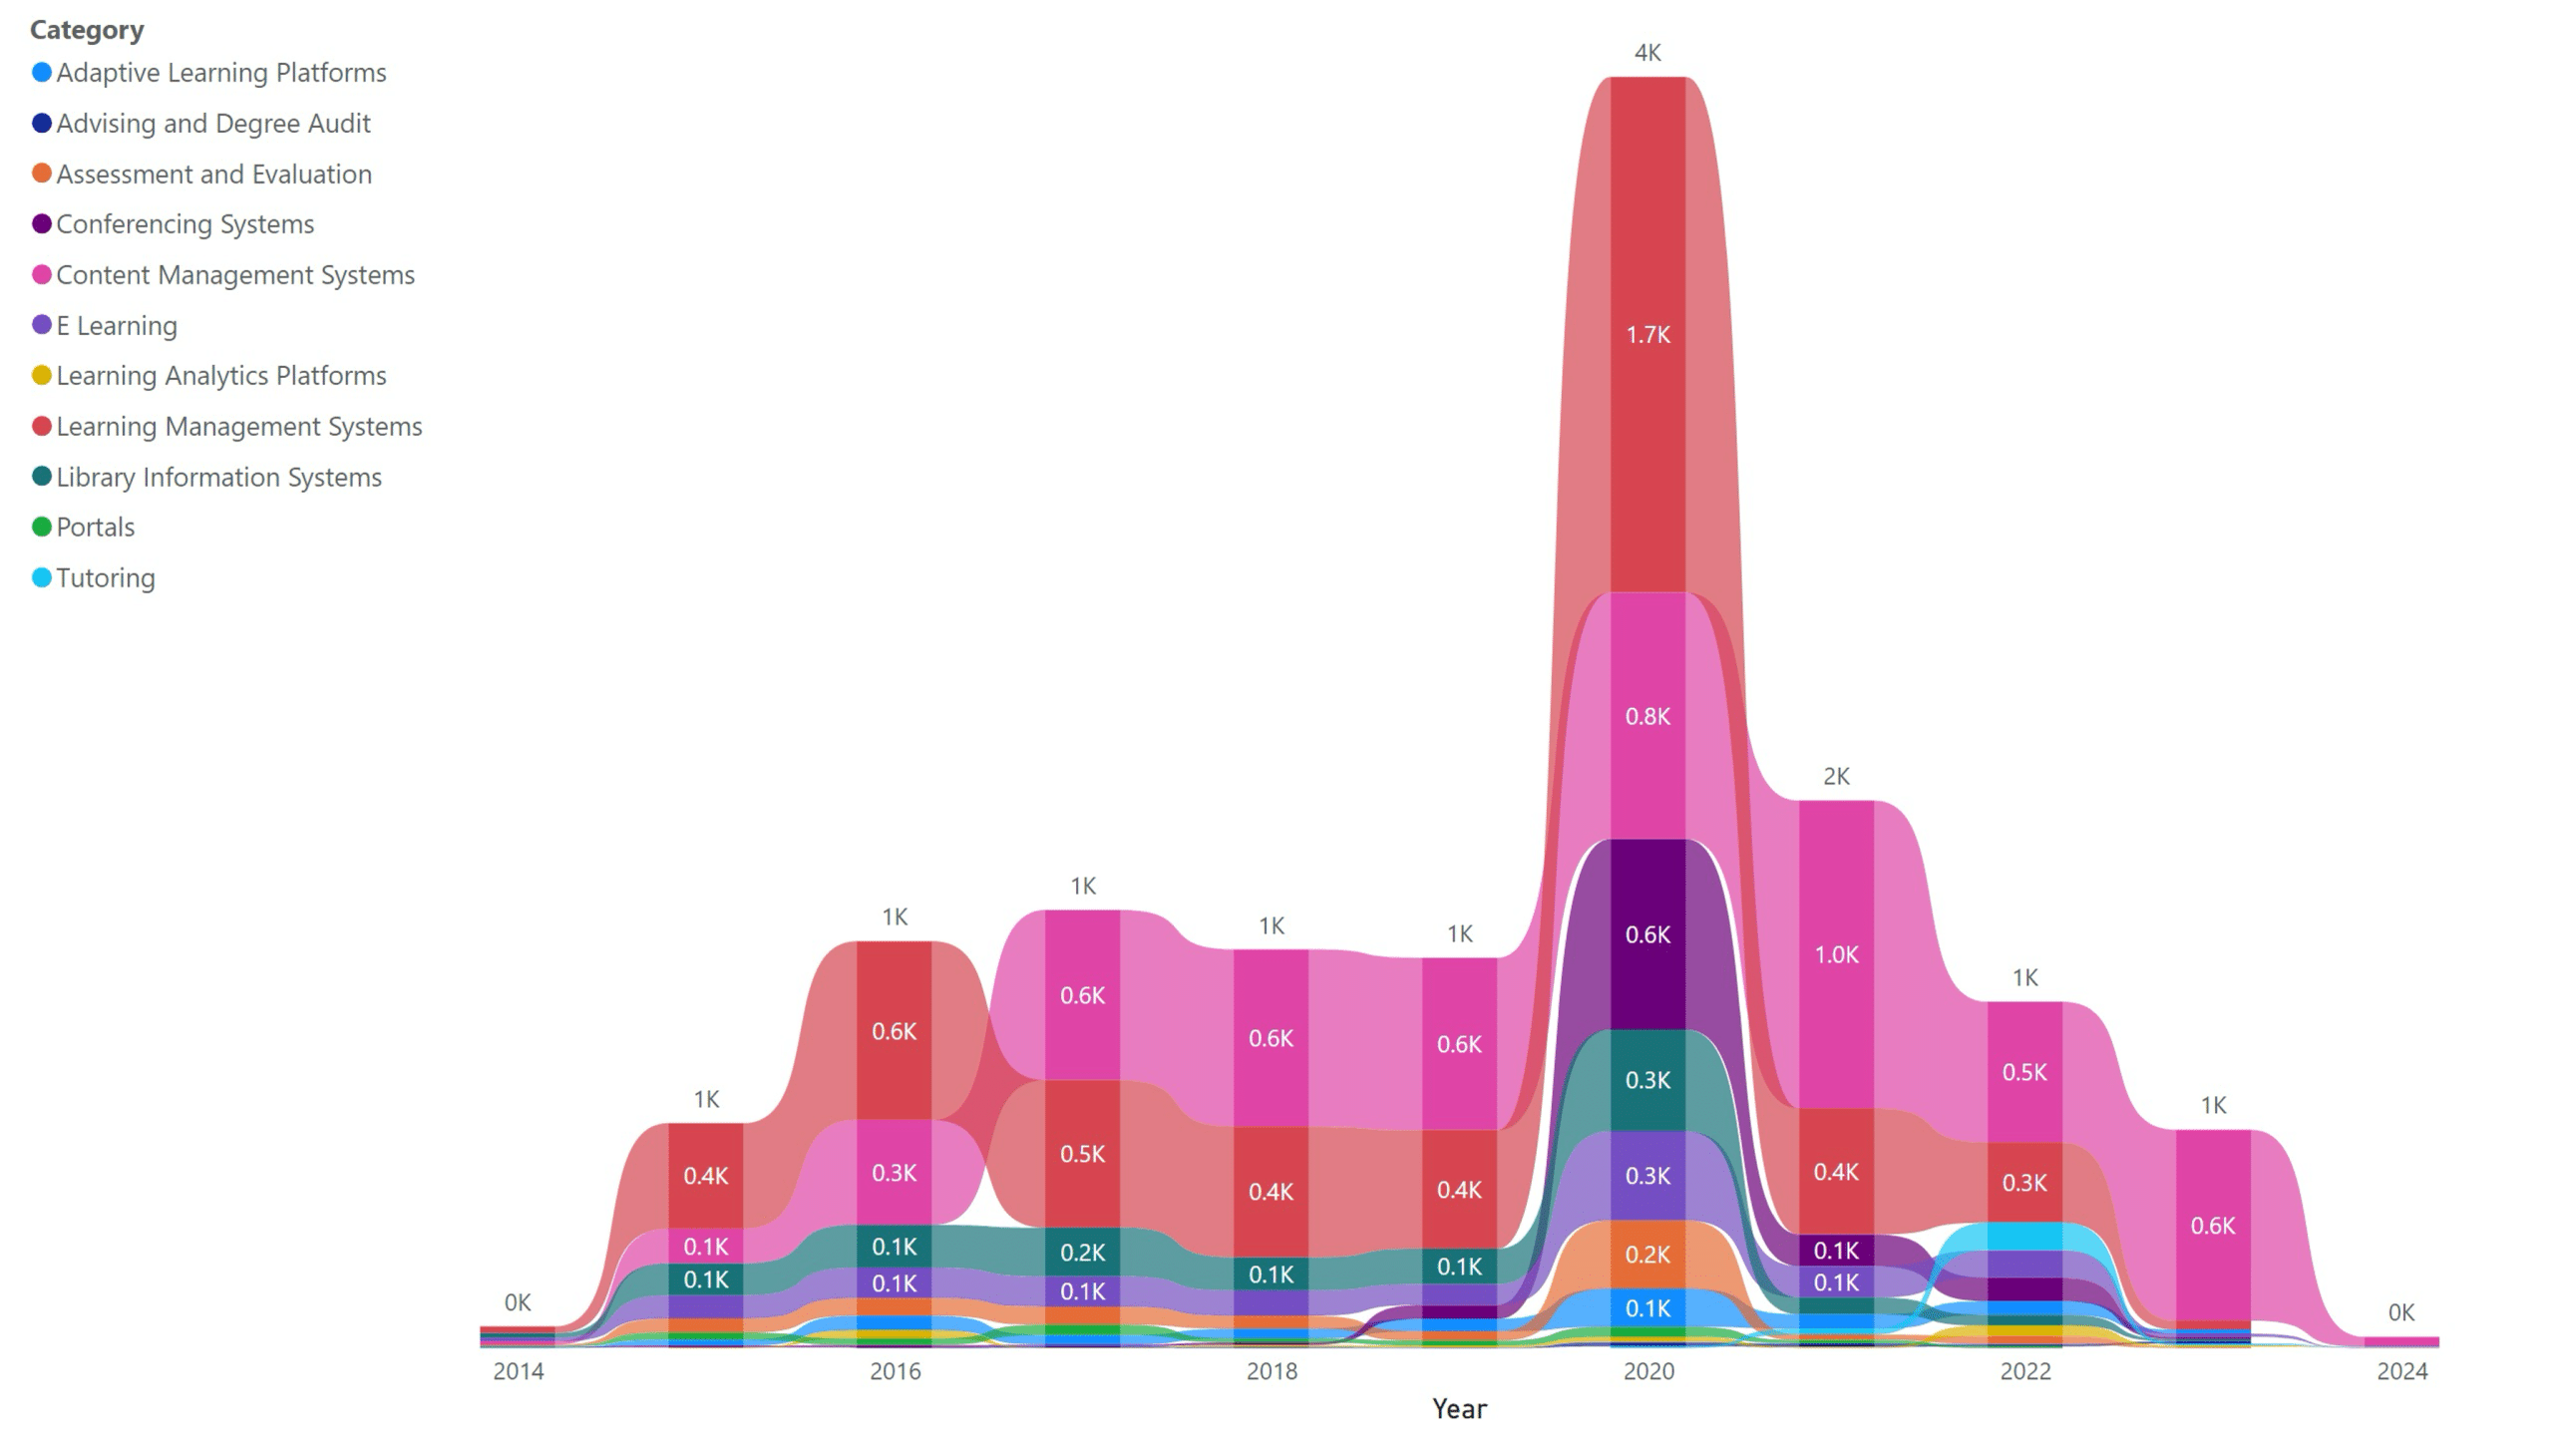
Source: ListEdTech
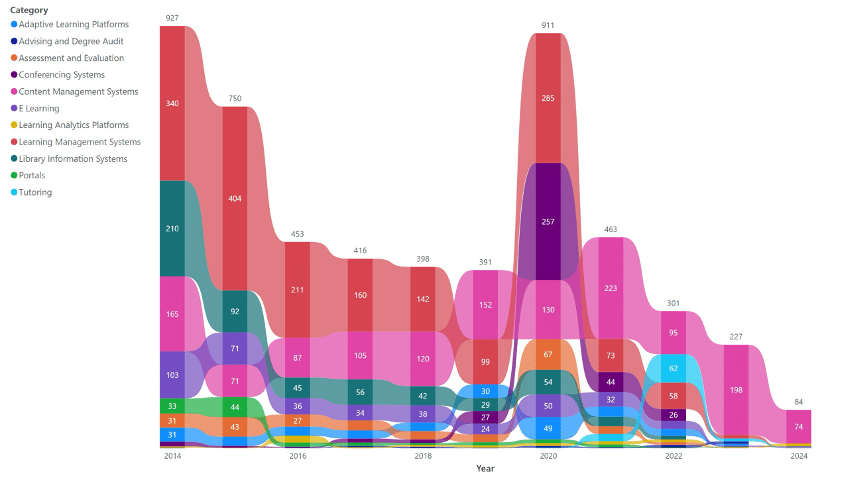
The second cluster (Figure 3) differs sharply from the previous cluster’s overall pattern. This cluster comprises over 2,000 institutions (93% of which are public). It had its most significant spike in implementations in 2014 and not 2020, with the largest implementations occurring in the Learning Management Category each year. Likewise, this cluster has a lower CAGR (9%) than the overall pattern and a lower CAGR (13%) than the previous cluster between 2019 and 2021. Lastly, categories within the cluster have the lowest combined annual growth rates during the same period, averaging 14% lower CAGR than categories in the overall pattern and 9% lower than the first cluster.

Source: ListEdTech
Why do these clusters matter? First, these clusters give us more insight into the interrelationship between implementation trends within US K-12 school districts. Rather than looking only at an individual segment’s (public, private, etc.) upward or downward movement, we now see segments showing similar implementation patterns over time.

Summary
This approach helps us better assess whether remote learning profoundly impacted US K-12 technology ecosystems. Consequently, rather than assuming all school districts rushed to implement teaching and learning technology at the same rate and intensity during the pandemic, we can leverage this approach to develop a more nuanced assessment of how US K-12 school leaders implemented technology in response to remote learning.
According to the overall patterns and clusters, implementations of teaching and learning technology in US K-12 school districts exhibit a downward trend from the middle of the pandemic, perhaps because district leaders are still deciding their post-pandemic pedagogical approaches. As a result, technology implementations will continue to slow down overall in the next few years.
