When we reposted Phil Hill’s blog post on school closures in April 2019, we received a comment from Andres Fortino, Principal at Fortino Global Education and Adjunct Faculty Member at NYU School of Professional Studies, who suggested taking in consideration the actual enrollment versus the number of institutions impacted by school closures: “I think you are looking at the wrong numbers. Please rework based not on number of institutions but on number of students affected. Enrollment would tell a different story.”
We finally got time to look at this data again and we put the student enrollment side-by-side with the number of institutions. In order to do this, we extracted the IPEDS’ data for each year making sure that the data collection year matched the requested enrollment year. This created 15 separate files that I merged into one.
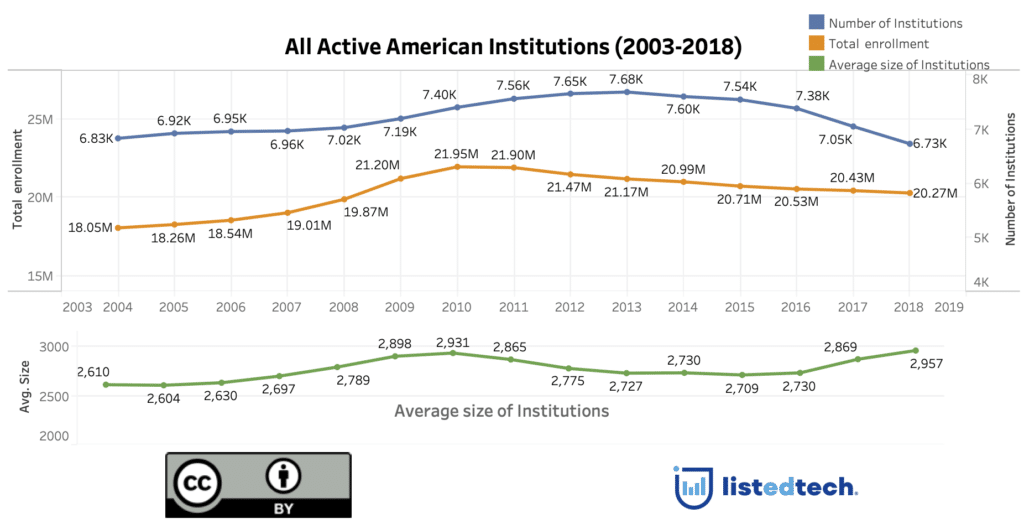
In this first graph, we can note that the number of institutions and the total student enrollment have both fallen. Enrollment peaked in 2010, yet the number of institutions peaked in 2013 and then shows a bigger drop. When we look at the average size by institution, the line does not follow the same pattern as the two lines in the upper part of the graph. This suggests that students generally moved to other institutions.
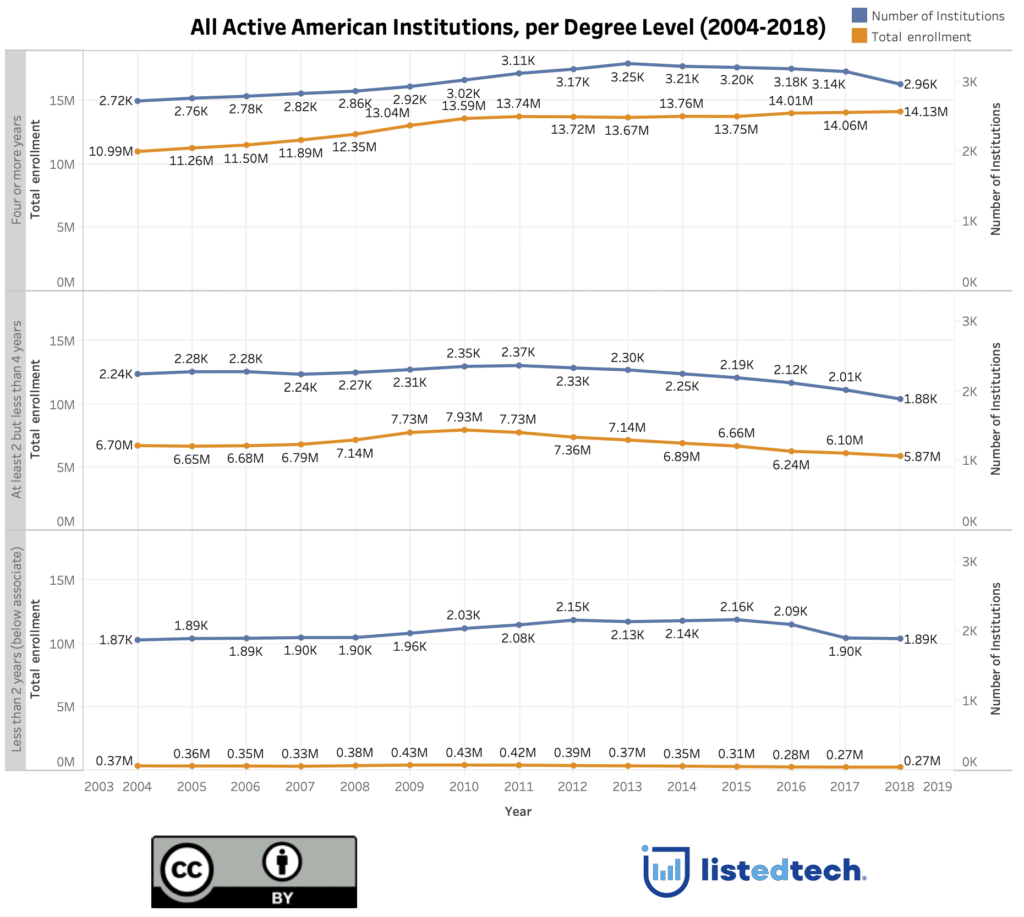
When we present the data on active American institutions per degree level, we notice that the student enrollment sees a slow but steady increase in student enrollment for the 4+ year institutions, even when we note several school closures, especially between 2017 and 2018.
The other segments saw more school closures than school creations since 2011 (for 2-4 year colleges) and since 2015 for “less than 2 year” colleges. Although the latter category sees a slight decline in student enrollment, the 2-4 year college category has declined significantly since 2010 with a net loss of 2M students.
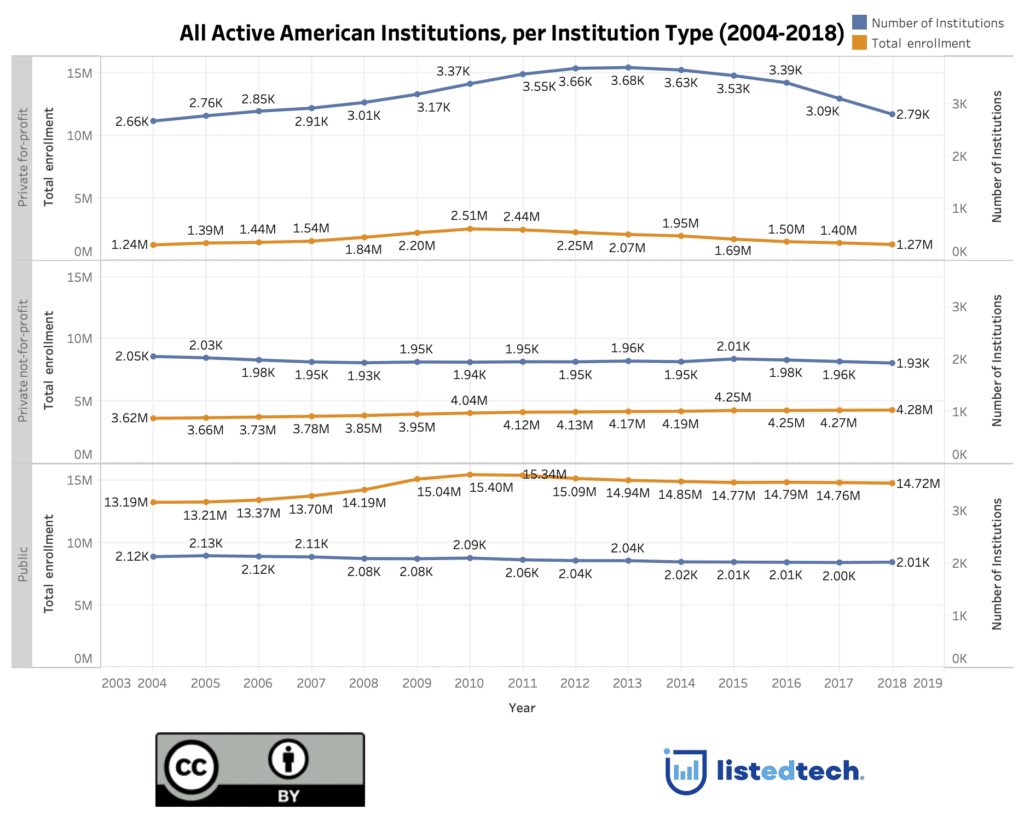
For the institution type, the private-for-profit category suffers the most when it comes to the number of students. Since 2010, there is a net loss of 1.24M students (-49.4%) in private-for-profit institutions compared to a loss of 4.4% for public institutions and a gain of 5.9% for private-not-for-profit institutions.
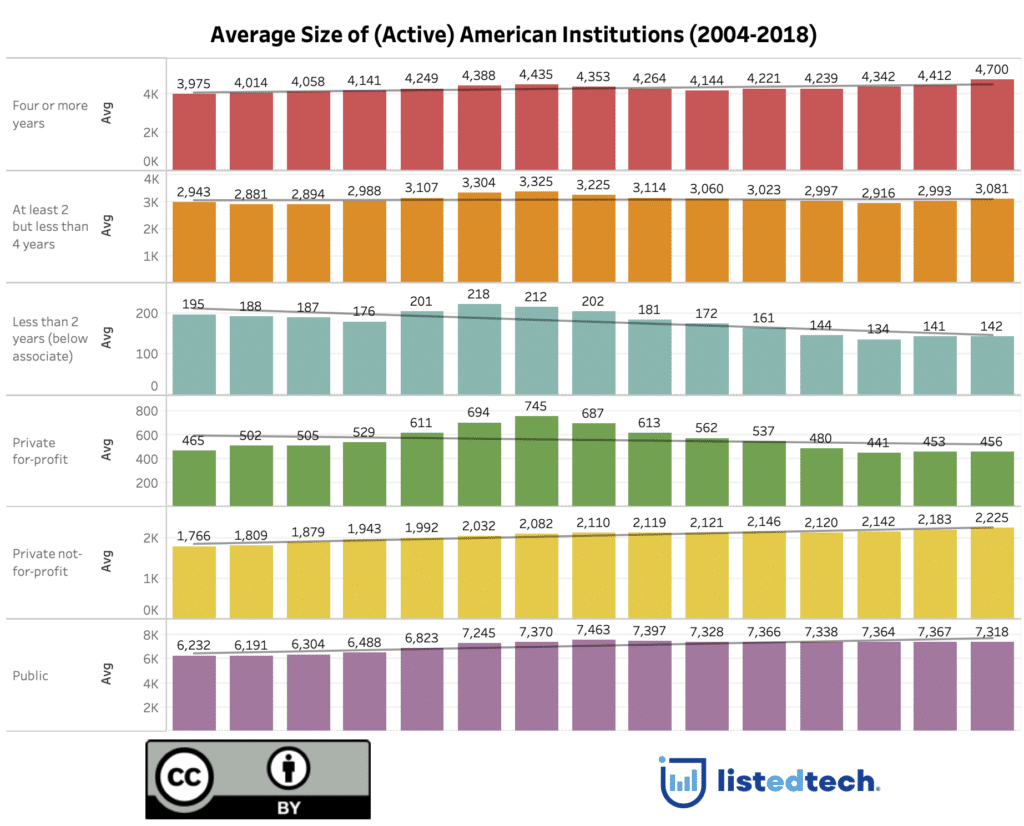
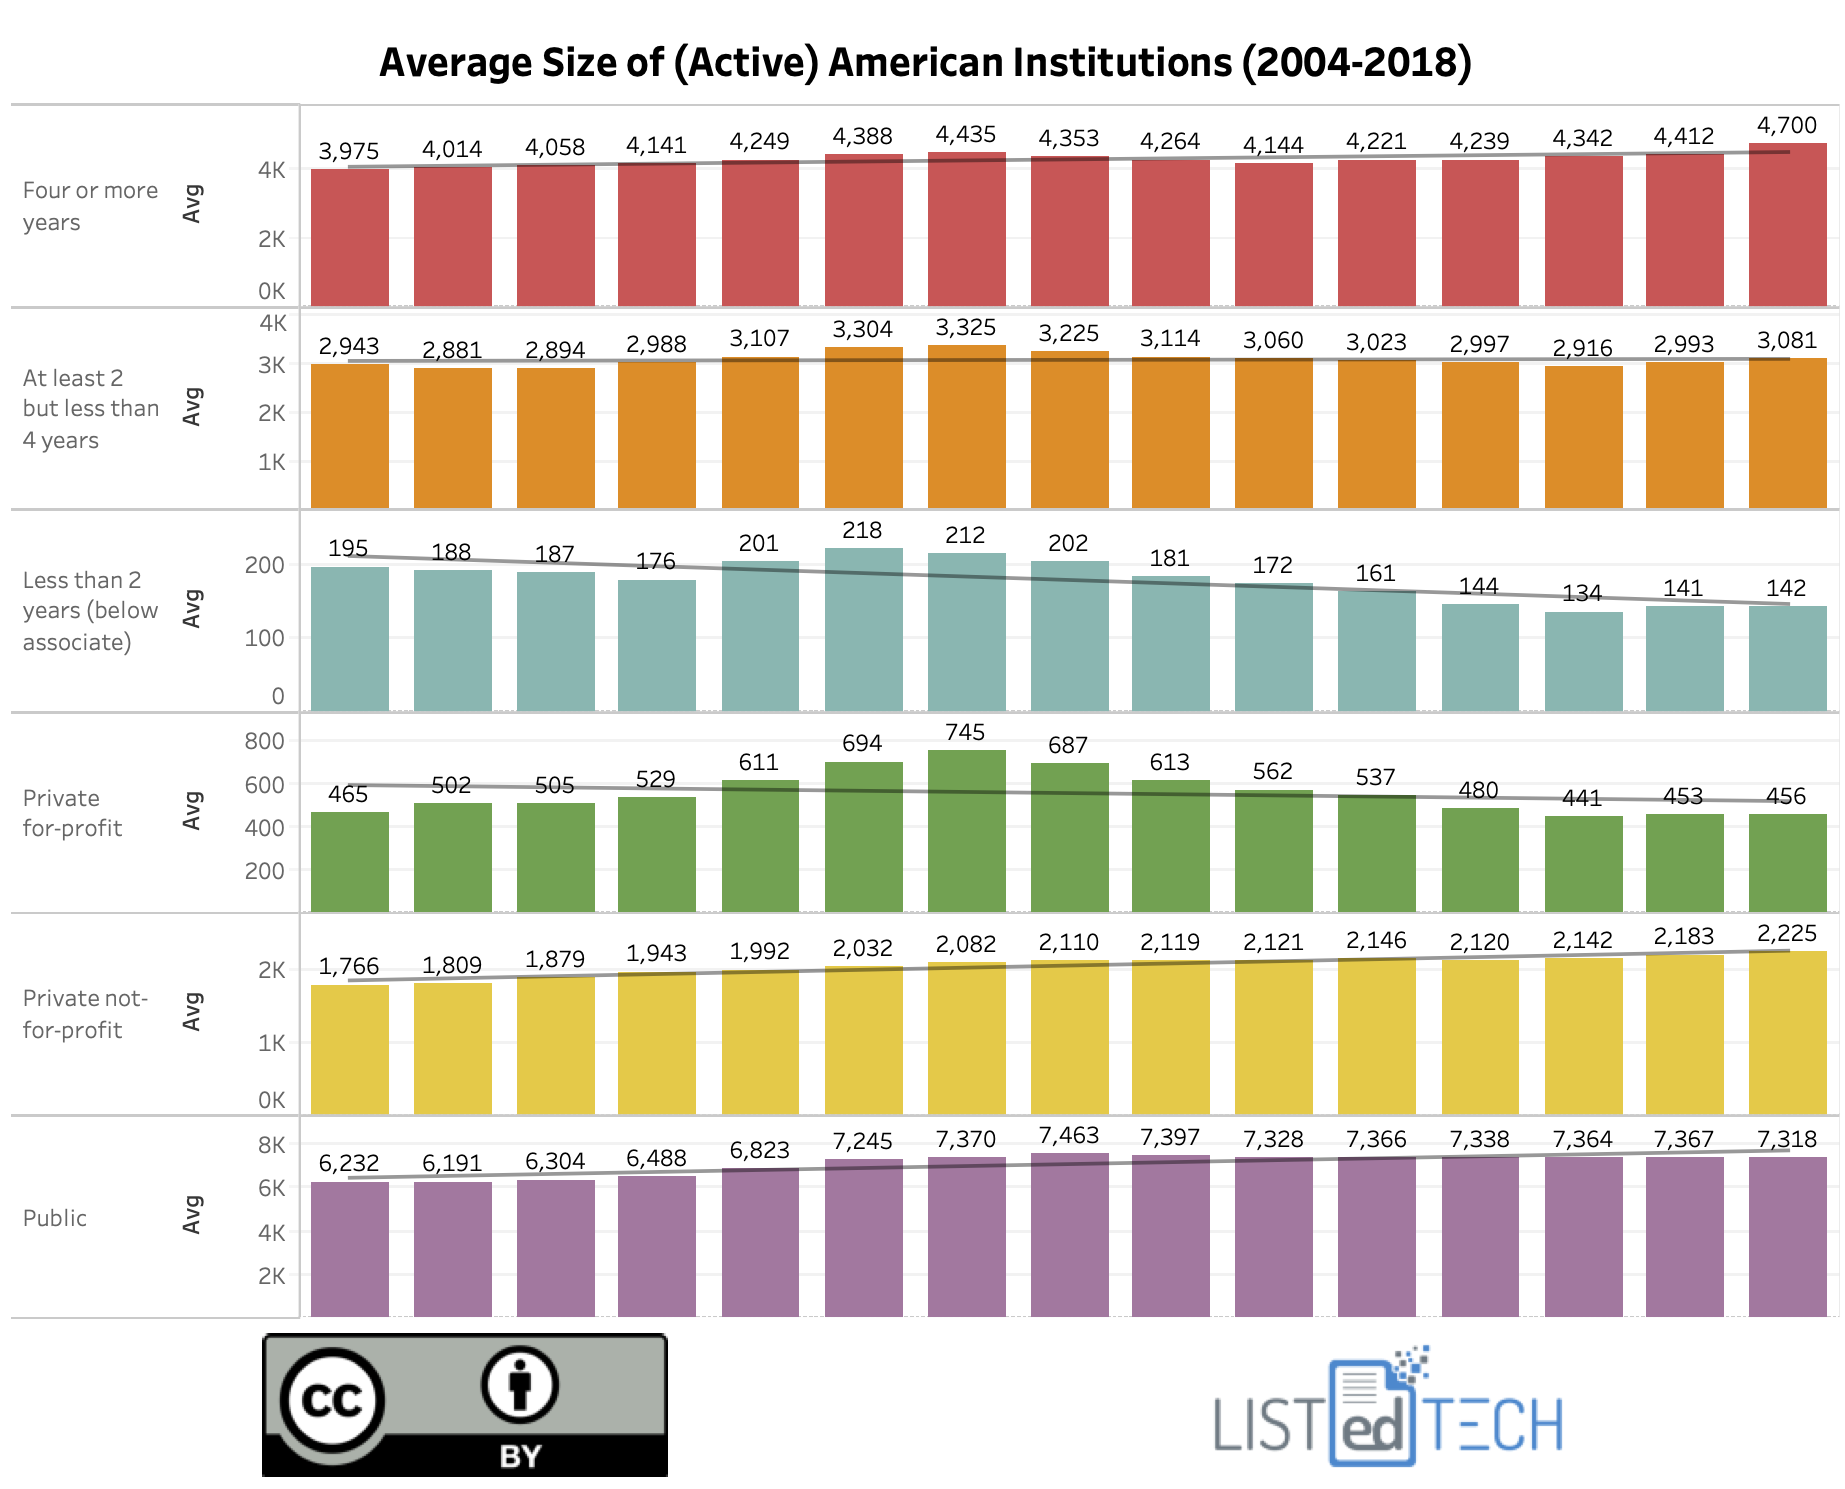
When we look at the fourth graph, we see that the average size of American institutions decreases in the private-for-profit and in the less-than-two year institutions. Over the past three to four years, we witnessed several big school closures in these two categories, corroborating the downward spiral we noted since 2010. Overall, though, this tendency of school closures does not affect students as strongly as the net loss of institutions may show. We believe that students pursue their education in another college.
Make sure to read this post from PhilonEdTech, including updated graphics showing US postsecondary institution closures and mergers.
