We often receive questions from institutional leaders and vendors about which bundles of technology institutions have implemented. Institutional leaders ask this question to inform decision-making about which technologies to implement. Vendors often want to gain insight into these bundles to understand how institutions arrange their technologies and see where their products might fit.
But is simply reporting out technology bundles meaningful? Might we be missing other patterns that better illustrate how institutions arrange their technology? In this piece, we will explore these questions using a technique called “frequent itemsets,” focusing specifically on implementations of technology related to teaching and learning.
Methodology
Before diving into our analysis, it might be helpful to understand our methodology. We began by selecting the most closely related to teaching and learning, such as the learning management system, course delivery systems, conferencing systems, and proctor systems. We then looked at all institutions in our data set implementing technologies in these categories. As a result, our analysis covered twenty-nine categories and just over four thousand institutions across all institutional sectors (public, private, two-year, four-year, etc.) and enrollment sizes.
After preparing our data, we performed a frequent itemset analysis. This analysis, used in other industries such as retail, aims to reveal the frequency of items and bundles of items in a data set and perhaps uncover surprising relationships. For example, in looking at retail data, we may find that people who buy hot dogs also buy mustard, but we may also discover that people who purchase diapers also buy beer. Accordingly, we may want to change our marketing and pricing to take advantage of these relations by offering a joint sale on hot dogs and mustard or rearranging our store to place diapers closer to beer.
Findings
The output of our analysis revealed just under seventeen hundred bundles, ranging from those that rarely appeared in our data set to those that appeared most often. Figure 1 shows the top ten bundles of technology related to teaching and learning according to the frequency with which they appeared in our data. Our analysis shows that most bundles contain the learning management system, which should not be surprising as so many institutions have implemented one. Yet there are some surprises in our analysis. For example, library management solutions appear in most top bundles, often alongside the learning management system. Likewise, although our data show nearly 3,800 implementations of proctor systems across colleges and universities, this technology appears in only two of the top ten bundles.
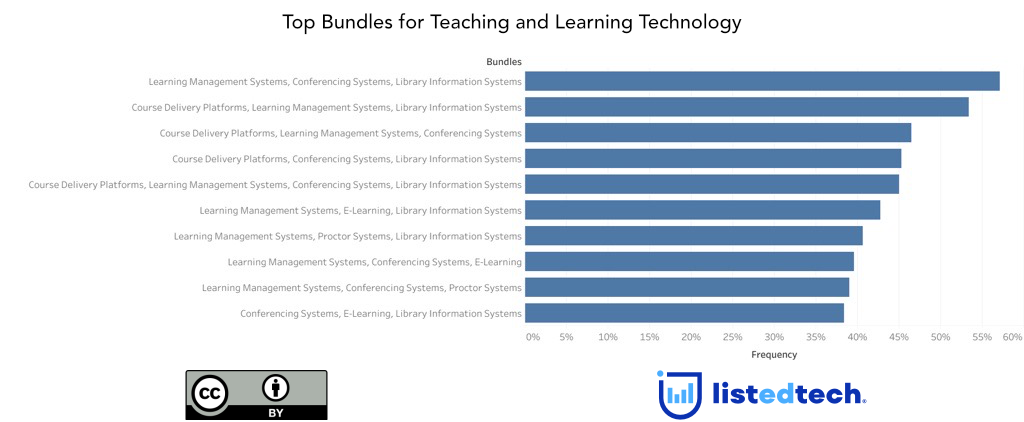
Why is this analysis critical? First, it reveals that the arrangement of technologies related to teaching and learning looks very different across the whole of higher education. For example, while most institutions have implemented learning management systems, some bundles, such as the fourth and last of the top bundles, do not include this technology. Likewise, the prevalence of library management systems in the top ten bundles suggests that this technology plays a more significant role in delivering and supporting teaching and learning.
Through this type of analysis, institutional leaders can gain better insight into how similar institutions are packaging their technologies, such as which solutions more closely relate to others, and make more informed decisions about their implementations. Also, by leveraging this analysis, vendors, especially those with products across different categories, can precisely see their markets and provide more targeted market strategies.
Summary
Understanding how institutions arrange their ecosystems is challenging, as many factors are at play, such as integration challenges, stakeholder interests, etc. Yet viewing technology bundles does provide some insight into these ecosystems, revealing likely patterns as the prevalence of learning management systems and unlikely ones (library management systems and the LMS, for example).
That said, while our analysis goes far, there still may be unanswered questions. For example, one may want to understand the predictability of relationships within bundles, such as whether the occurrence of a learning management system likely leads to the occurrence of a library management system within the same bundle. Likewise, one might ask about bundles for different institutional types (public, etc.), enrollment size, or other dimensions (retention rates, for example).
In future research, we will continue refining this analysis to address these and other questions. We look forward to presenting our findings and receiving feedback over the next few months.