Known for his disruptive innovation theory, Clayton Christensen said in February 2013, “15 years from now, maybe half of the universities will be in bankruptcy… including state schools.” Four years later, in 2017, he even claimed it would take less than a decade, “probably nine years,” for this to happen. At the time, to support his idea, he mentioned the rapid growth of online learning that could inevitably accelerate things.
Since these two statements, the pandemic hit, and online learning skyrocketed. Even if we have since managed to live with COVID-19, some universities have yet to return to in-person training or modify their offerings to propose hybrid classrooms. In addition to online learning acceleration in higher education, other factors happening in higher education could have influenced Christensen to make his statement using his disruptive innovation analysis:
- Rising Costs: Higher education costs were increasing faster than inflation, making college education increasingly unaffordable for many students and their families, which led to an ongoing student debt crisis.
- Competing Models: New and innovative education models, such as competency-based education and employer-driven training programs, were emerging, which challenged the traditional four-year college degree model.
- Job Market Mismatch: There was a growing perception that traditional university degrees were not always aligning with the skills and qualifications demanded by the job market.
- Technological Advancements: Technological advancements were changing how education was delivered, and traditional universities might need help to keep up with the pace of innovation.
This blog post is a follow-up to one of Phil Hill’s articles. In 2019, we provided him with a few graphs that demonstrated the closures of schools in the US. Ten years after Christensen’s initial claim, we ask ourselves: have these closures accelerated or slowed down? Have we hit the 50% mark?
Analyzing the HigherEd Closures
As of July 2014, IPEDS reported 3,122 universities across the United States. Note: we use the academic year 2013-2014 for our analysis since IPEDS numbers can be delayed by up to two years. Therefore, this data should be easier to compare with Clayton Christensen‘s statement. Also, it is crucial to remember that we don’t have all the closure numbers from IPEDS for 2022. This situation makes the 2022 numbers a bit smaller than they should be.
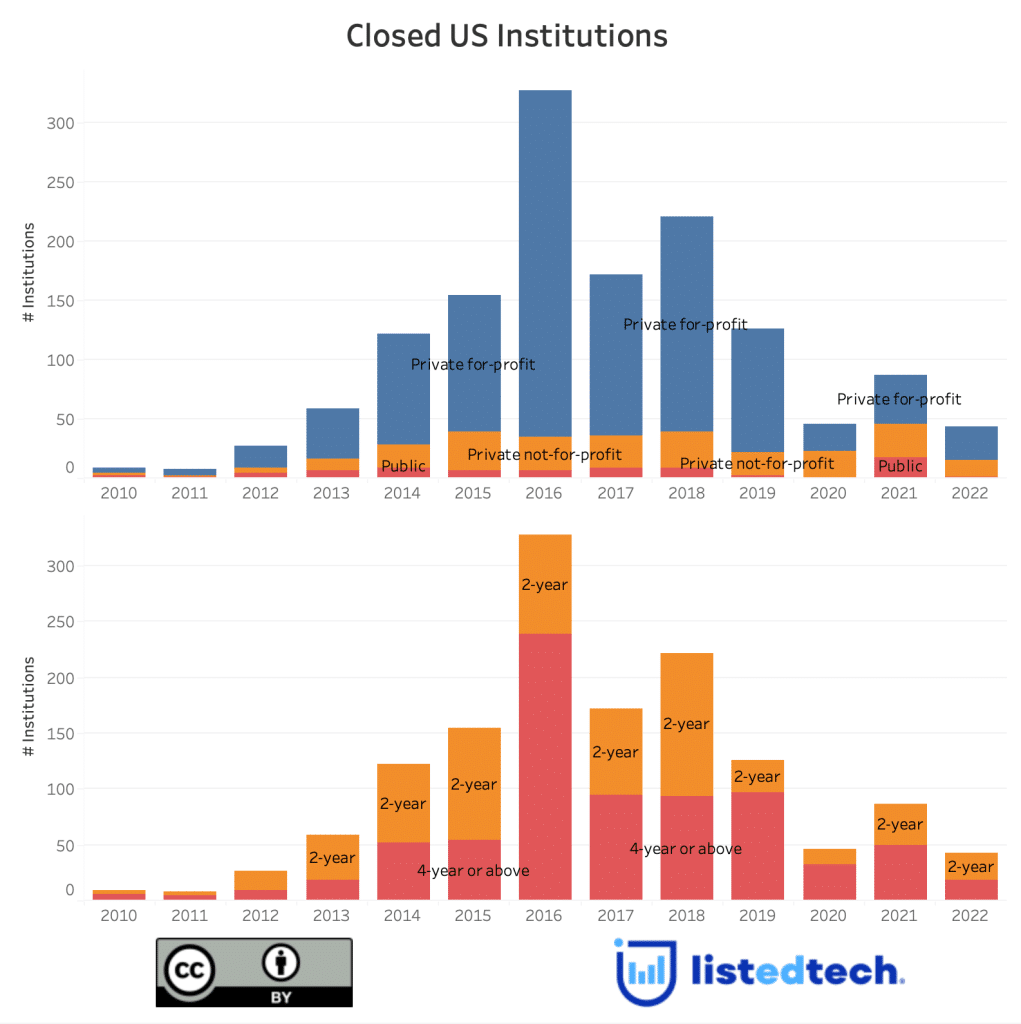
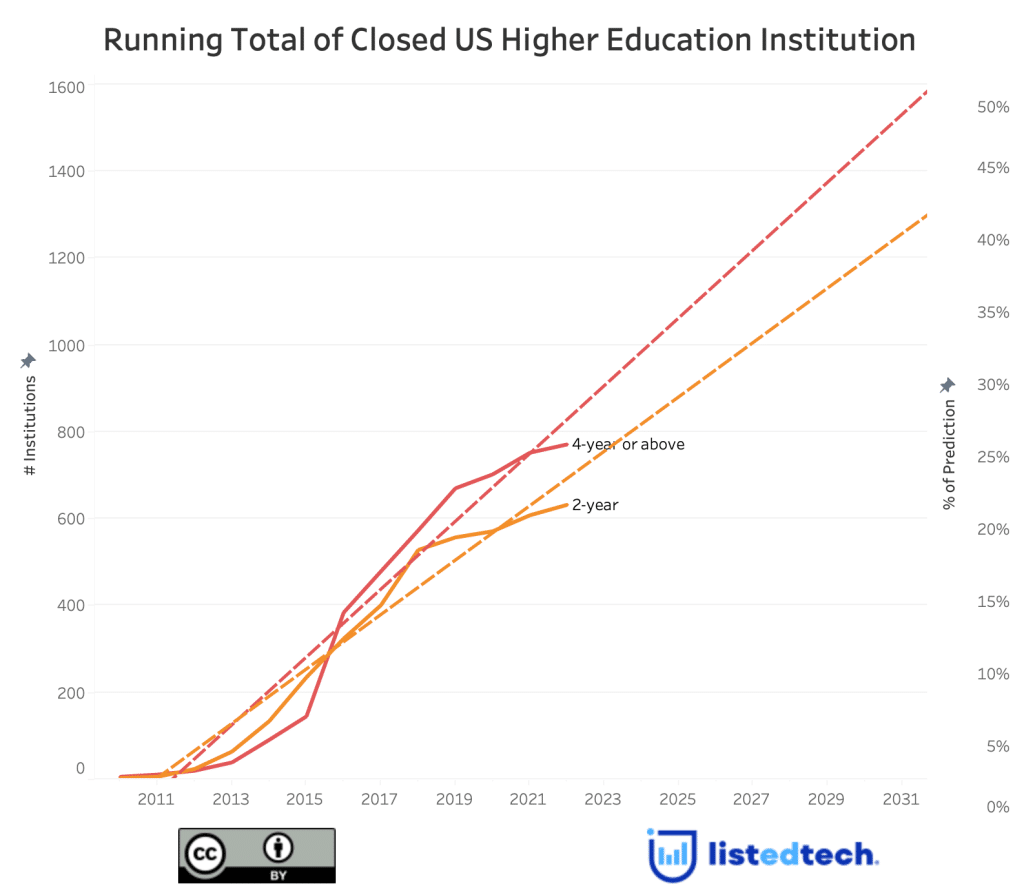
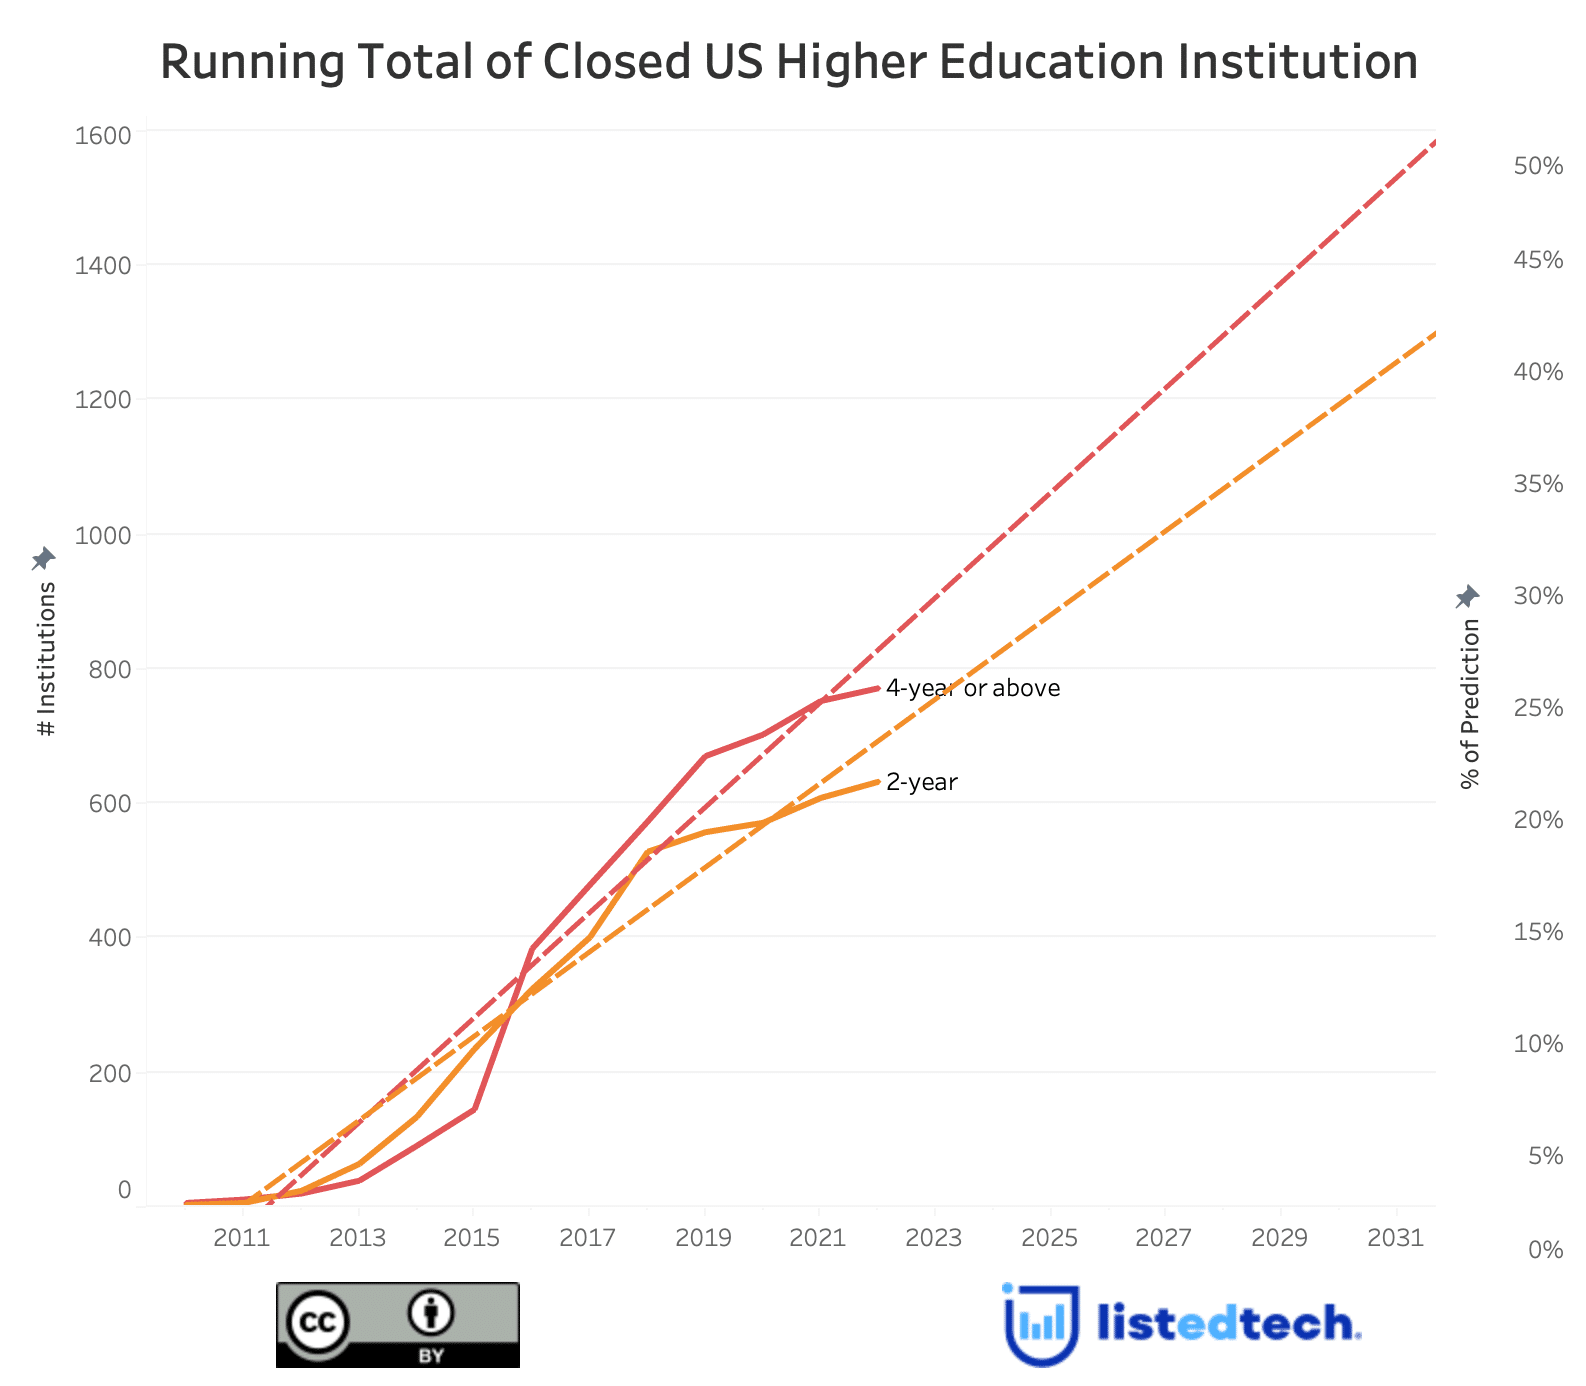
Before 2013, there were few closures among 4-year US institutions (20 over three years). Then, it increased: 19 in 2013, 52 in 2014, and 54 in 2015. Looking at the graph, we understand why the numbers led Christensen to believe that his prediction could occur more rapidly than in 15 years. The year 2016 saw 239 school closures in the 4-year institution group. We understand why he moved up his prediction to nine years at that level. Fortunately, the year 2016 was the exception rather than the rule. If we remove 2016 from the graph above, the trend line would be moderate, as the biggest closure years are around 90.
The graph below shows that most closures happened in private for-profit school groups. Returning to Christensen’s statement of 2013, he said that these closures included state schools. Because of the words used, we initially thought that closures among public schools would be significant. The second graph shows that public institutions (including state universities) only count for 5% of closures. Note that this graph comprises 2-year colleges and 4-year universities.
Is Christensen’s Prediction Accurate?
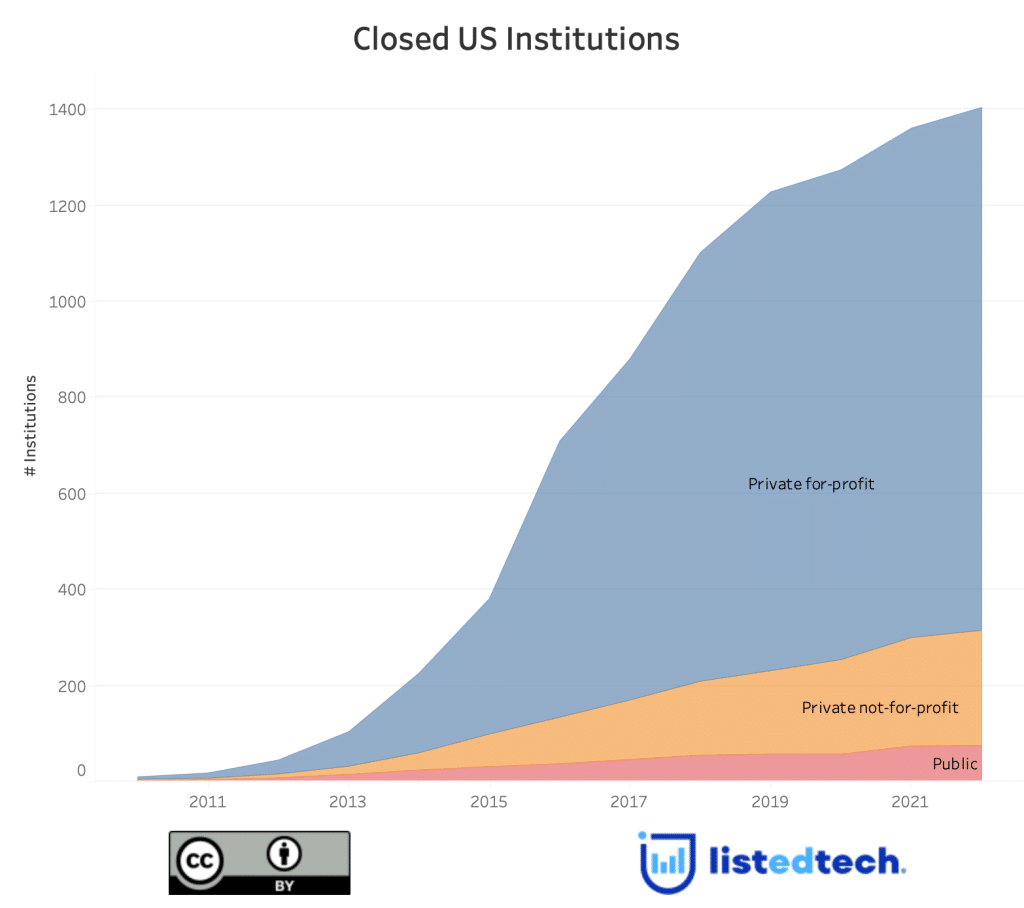
Christensen’s prediction was a bold one. How could someone predict the profound transformation of the industry that employs millions of people in the United States, including himself? During the Startup Grind 2013 interview, Christensen made his predictions based strictly on universities and not on all post-secondary education (2-year colleges, 4-year or above universities, and other types of higher education). His revised prediction falls short if we only calculate Christensen’s prediction with university numbers: one-quarter (24.9%; 778/3,122) of universities have closed since 2013. If we add 2-year colleges to the equation, 26.4% (1,412/5,352) of higher education institutions have been defunct since 2013.
Now that we know that Christensen’s prediction did not occur in the revised timeframe he indicated, we could ask ourselves: when will Christensen’s prediction become true? To answer this question, we have created a predictive graph (below) based on the past 12 years of data. Using this graph, Christensen’s prediction might come true in his original timeline.
This is not to say that the higher education sector has not been hit hard. All the factors mentioned at the beginning of the article have come true and constitute the new reality of education. And that’s not counting the artificial intelligence that is transforming our lives. Christensen’s statement may be off, but it still represents a possibility, and we must prepare for it.
