Those interested in education technology often want to get insight into when institutional leaders are likely to replace their technological solutions to make better predictions about future trends, or inform sales and marketing efforts. The most common approach to gain this understanding is to look at the average time between acquisitions and retirements of products at institutions, considering these to be indicators of when these changes might occur.
But is this metric, taken on its own, enough to understand when institutional leaders are likely to replace their technological solutions? Might we be missing other factors, such as the rate of replacements, that better give us insight into market behavior? This piece will explore this question using a survivor analysis technique, focusing on the learning management system (LMS) category.
Methodology
Before diving into our analysis, we should first understand survival analysis. Simply put, survival analysis measures the time to an event. As its name suggests, survival analysis occurs mainly in medicine, where researchers in clinical trials seek to establish the time between an initiating event (start of treatment, diagnosis, etc.) and a terminal event, such as death, cure, or relapse. Others have applied this approach outside of medicine to gain insight into the time until a stock market crash, the time until equipment failure, or the time until an earthquake.
Our analysis focuses on the time to the retirement of an LMS, overall and by product. For our analysis, we leveraged the implementation dates and decommissioned dates for over 3,000 institutions in the United States across all sectors (public, private, two-year, four-year, etc.). We only included implementation dates that covered all products to ensure that our analysis did not produce findings that skewed toward or against those not in existence at a particular time. Therefore, we excluded those implementations before certain companies existed, such as implementations before 2008, the founding year of Instructure.
Findings
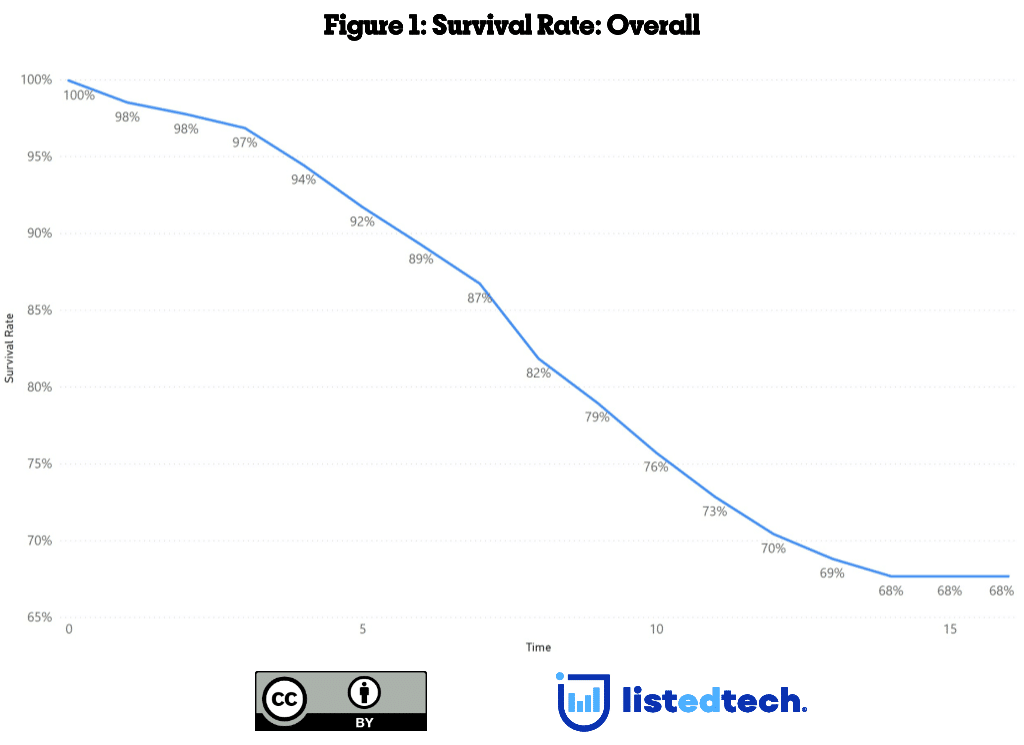
Figure 1 shows the output of our analysis for all LMS since 2008. The Y-axis shows the proportion (“survival rate”) of those institutions that have retained their original LMS over time (X-axis). For example, our data shows that, after 15 years, 68% of institutions have not changed their learning management systems. Likewise, our analysis reveals that LMS retirements occur slowly and steadily, with a yearly survival rate between one and five percent.
Survival Data by Product: Retirements Affect Some Products More Than Others
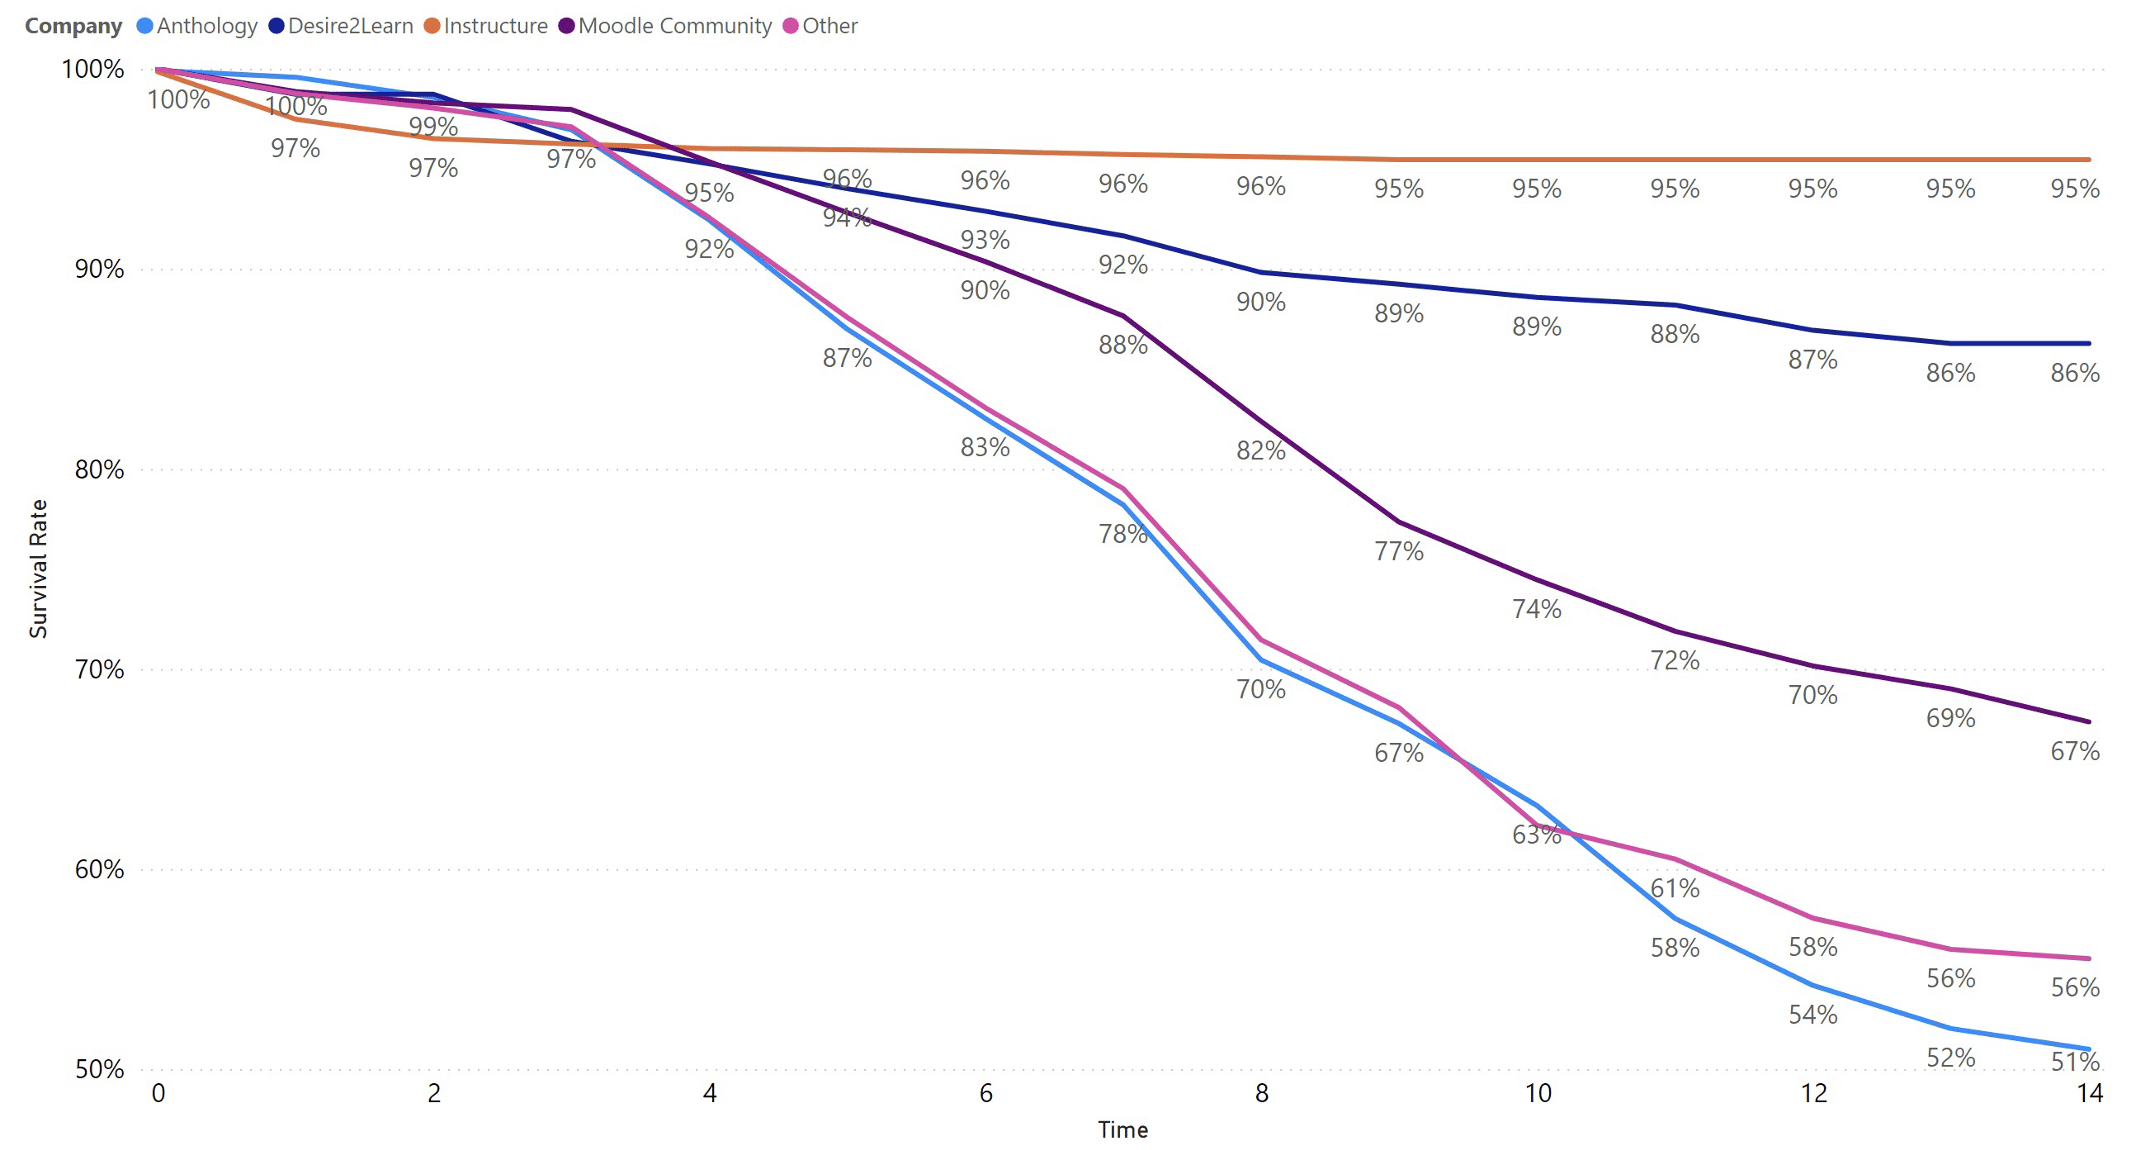
However, viewing the survival data by product yields a much different picture. As shown in Figure 2, D2L and Instructure have the highest survival rates over 15 years, with Instructure holding on to ninety-five percent of its implementations and D2L retaining 86%. On the other hand, nearly half of all institutions have retired their Anthology implementations after fifteen years, followed by 44% of other learning management systems.
Likewise, unlike the slow and steady decrease in LMS overall, certain products suffer steep drops in their survival rates. For example, Anthology’s survival rate dropped by eight percent in the eighth year, followed by other LMS in the same year (7.5%). However, other products, such as Instructure and D2L, hold steady over time, with no more than two percent of institutions replacing their products each year.
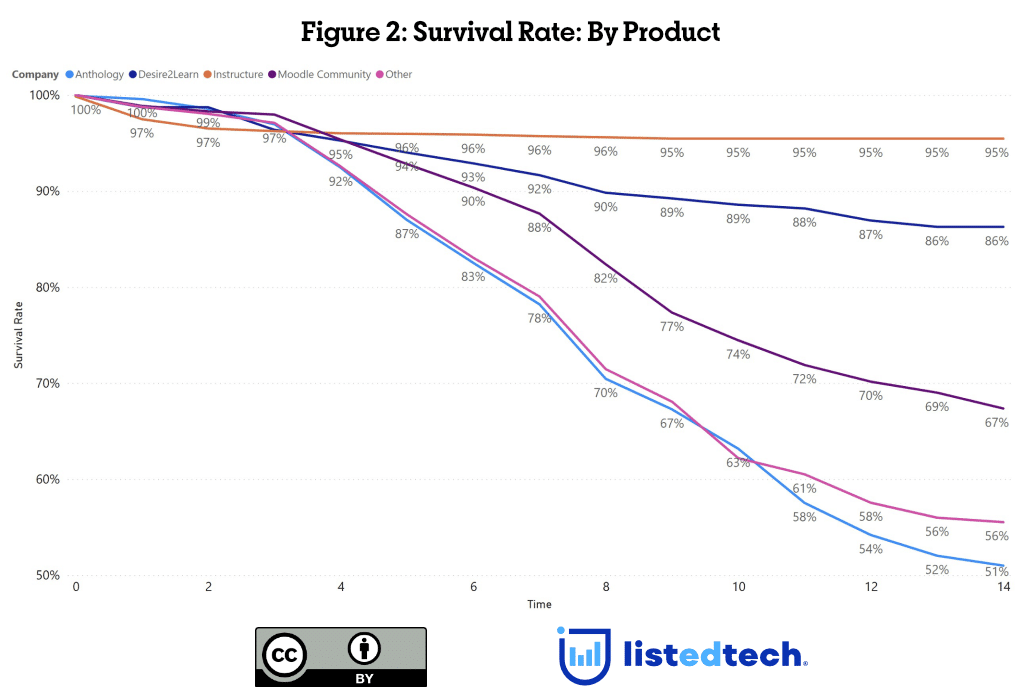
What does this all mean? First, it shows that institutional leaders are hesitant to change their LMS, as over two-thirds retain the system they implemented 15 years ago. Also, our data indicates that there are no sudden spikes in changing learning management systems, with no sudden and significant yearly changes. However, at the product level, we see some volatility in LMS retirements, with Anthology showing the most, and no actual volatility in other LMS, such as Instructure and D2L.
Finally, we should note that our analysis does not account for the systems with which institutional leaders chose to replace their learning management systems. Further investigation might reveal, for example, that leaders who decided to retire their Anthology Learn replaced it with Anthology Learn Ultra. Also, as we discover more data about retirement dates for products and adjust our database to update data about implementation dates, we might find that our analysis yields different results.
Summary
Understanding the average time between implementations and retirements is valuable as we can gain insight into how long institutions retain their implemented technologies and perhaps shed some light on institutional priorities relating to technology, such as resisting change to large-scale solutions like the learning management system. Yet viewing the time between implementations and retirements through the lens of a survival analysis provides additional insight that considering average age alone obfuscates, enabling institutions to see which products retain their attractiveness after implementations, vendors to see where they might improve their customer retention efforts, and researchers to make better predictions about the market.
In future research, we will continue refining this analysis. For example, how might this analysis look if we disaggregated the findings by institutional sector? Likewise, are there drivers contributing to the results, such as institutional responses to the pandemic? We would love to hear your feedback. Please feel free to reach out if you like.
