ListedTech
  • Data Portals
    • Portal for Industry
    • Portal for Institutions
    • Webinars
  • Product Categories & Reports
  • Resources
    • Blog
    • Podcast
    • Documentation
    • Webinars
  • About Us
    • Our Story
    • Data Overview
    • Traditional IT Research vs. ListEdTech
    • In the Media
    • Contact Us

Search the website...

Go to Portal
Posted on March 20, 2013 | by Justin Ménard

World University rankings by Country – part 2

Institution Data

This is the second part of our world university rankings posts. See the first post that lists the top 100 universities (based on 9 world university rankings). Based on almost the same logic used in our first post, we took the top 300 universities and compiled the 9 world rankings. Note that, for some universities, we only have 8 rankings. We took this liberty since our goal wasn’t to show a list of the top 300 but rather to use this listing to analyze the respective countries to which they belong.

In our initial post, one of the striking facts was that 50 of the top 100 universities are from the United States. In the top 300, the United States has 91 of the best rated 300 universities. This is an astounding amount considering that some rankings have over 20 000 universities worldwide.

How can this be explained?

To try and make sense of this, I have added two extra data points: endowment and gross domestic product (GDP – Thanks for the tip Gavin Moodie).

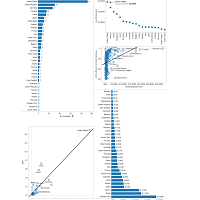
If we sort the universities by endowment (in descending order), 19 of the top 20 belong to the United States. In the top right visualization, the average university endowment by country is displayed. The US has 3x the average amount when compared to most countries. Now, this could be a chicken and egg issue. So what came first, the ranking or the endowment?

In the following visualization, we basically eliminate the correlation since the relation between ranking and endowment isn’t that solid.

A better indicator of hight ranking is the country’s GDP. This can be seen in the bottom left visualization: GDP vs number of universities in top 300. You can remove the United States (hover over United States and click exclude) to better view the other countries. The horizontal bar chart on the bottom right shows the country GDP divided by the number of institutions in the top 300.

A few notes on the data: We only have endowment data for 171 of the 300 universities. Therefore some countries don’t appear in the endowment sections. The GPD data was taken from worldbank.org and the endowment information from Wikipedia.org.

Post navigation

9 World University rankings – Side by side – part 1
The Best MOOCs
  • Subscribe to Our Newsletter
  • CAPTCHA image

    * All fields are required.

  • Listen to Our Podcast


  • Recent Posts

    • K-12 LMS Market Update & Insights: May 2026 May 20, 2026
    • EdTech Incidents Come and Go. Responses Last Longer. May 13, 2026
    • Canvas Reimagined: Tiered Platforms and AI Strategy April 29, 2026
    • The Future of HigherEd: Moving Beyond the Legacy ERP to Agentic Innovation April 22, 2026
    • AACRAO’s Evolving Landscape: Signals from the Exhibit Floor April 15, 2026

Stay in the know…

Blog & News
ListEdTech

K-12 LMS Market Update & Insights: May 2026

Over the past decade, the K-12 Learning Management System (LMS) market has undergone significant consolidation and shifting user preferences. Our historical data shows that while some legacy systems have steadily declined, a clear trio of dominant platforms has emerged to capture the vast majority of the K-12 market share. Using the latest data from the ... K-12 LMS Market Update & Insights: May 2026  Read More
Cybersecurity

EdTech Incidents Come and Go. Responses Last Longer.

Last week, much of the conversation in EdTech focused on the recent Instructure / Canvas security incident. I received several emails asking whether we would cover the event in our weekly post. Since we had just finished our company summit and I’ve been traveling with my family, I was honestly happy to let others take ... EdTech Incidents Come and Go. Responses Last Longer.  Read More
Learning Management Systems

Canvas Reimagined: Tiered Platforms and AI Strategy

A few weeks ago, I sat down for a demo with Instructure to get a look at their new product tiering and AI platform strategy for Canvas. It wasn’t just a product update; it felt like a snapshot of where the entire EdTech market is headed. We’re seeing a massive shift in how software is delivered to schools ... Canvas Reimagined: Tiered Platforms and AI Strategy  Read More
Footer Logo - LisTedTECH
  • Contact Us
  • Frequently Asked Questions
  • Privacy Policy
  • Terms of Use