Over the next week, we plan to publish new data looking at closed institutions in the U.S. – both as a general topic based on sector and more specifically on the tie to LMS vendors.
The issue is that, for market share, there is a numerator and a denominator. Numerator changes (such as new implementations) have been covered much more than denominator changes (such as school closures). With the turmoil in the for-profit sector as well as the ongoing closures of small private colleges, we need to focus on both.
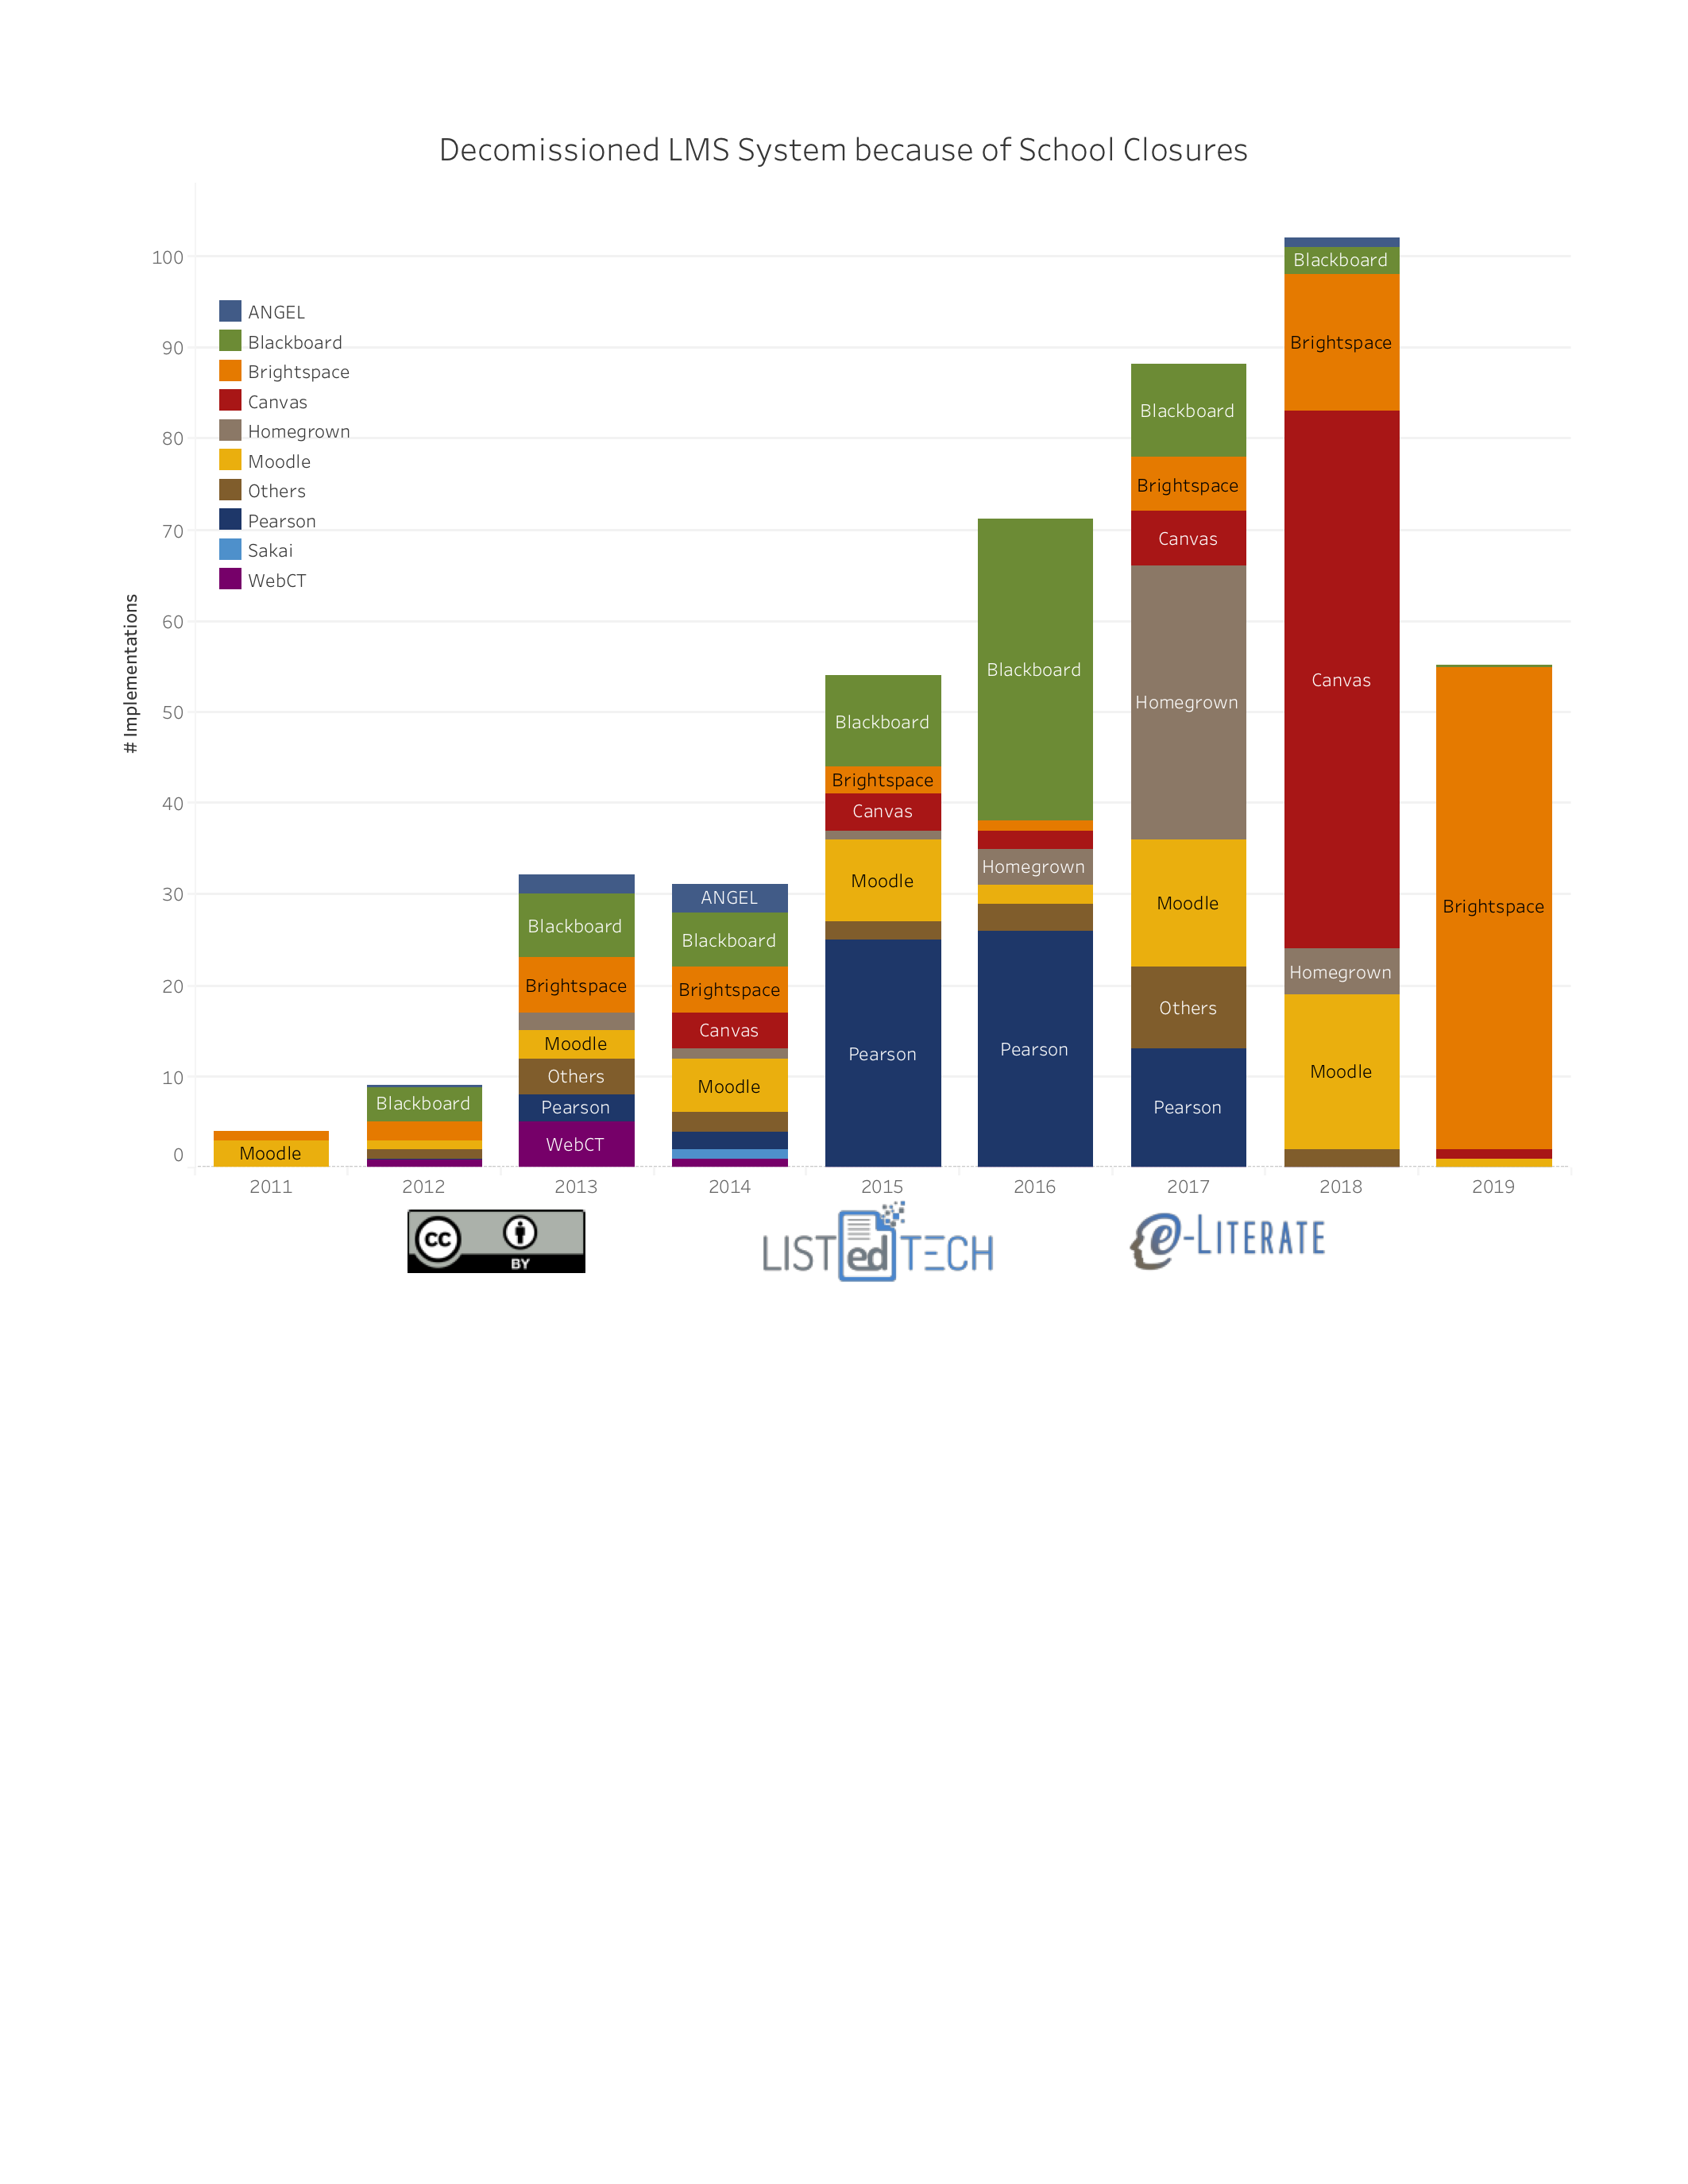
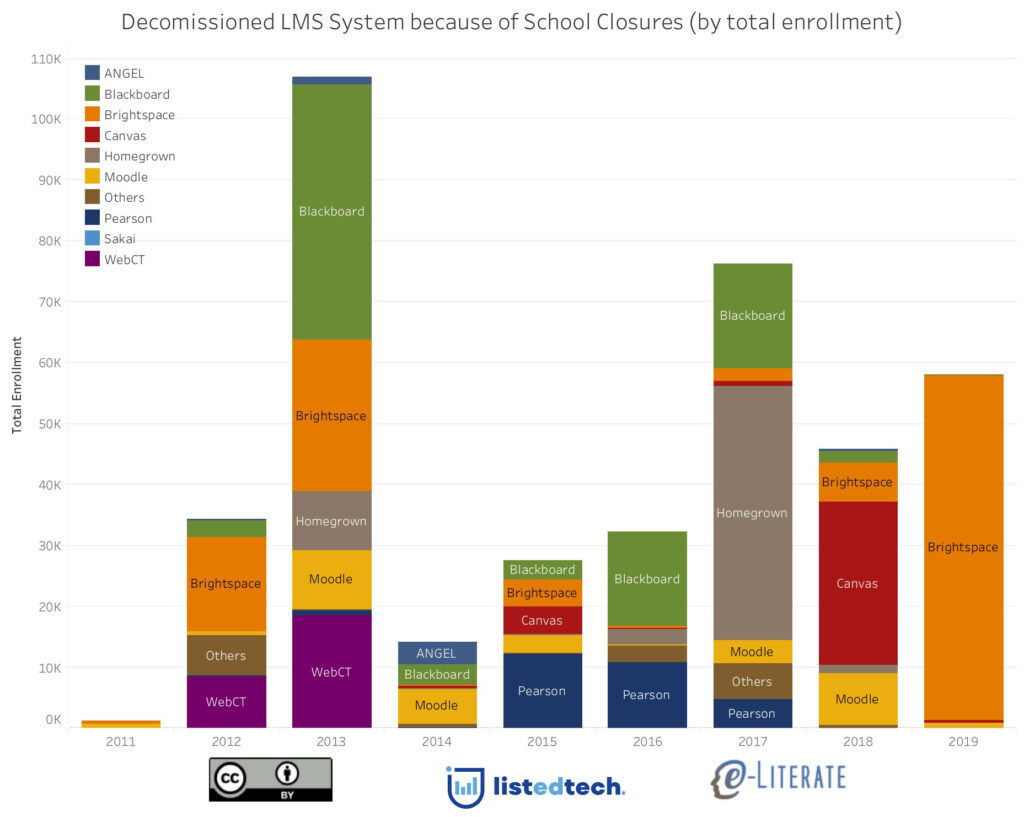
Here are two charts showing the connection with LMS providers for the schools that have closed. The first is based on the number of institutions as defined by IPEDS, the second one is scaled by enrollments.


The growth in number of closures is striking, but the overall numbers of students affected is a relatively small portion of the higher ed market. In other words, yes, it’s a big deal that institutions are closing and this has an effect on revenue, but effects are somewhat marginal due to lower enrollment numbers. If the closure trend continues, and especially if it picks up, impacts will become more pronounced for market share numbers.
Some items to note:
The 2012 / 13 spike in enrollment-based closures included significant consolidations at the University System of Georgia. We are figuring out how to represent this case, but for now, please don’t over-interpret those two years.
The 2017 / Homegrown data was driven by University of Phoenix closures.
The 2018 / Canvas data was driven by ECA closures.
The 2019 / Brightspace data was driven by EDMC / Dream Center closures.


