Many institutional leaders seek to understand which technology other similar institutions have implemented before partnering with a specific vendor. In a previous post, we revisited our approach to determine institutional peers, intending to inform this institutional decision-making, leveraging many variables from the Integrated Postsecondary Education Data System (IPEDS), such as institutional sector, enrollment size, etc. But can we go deeper? Might we gain better insight into what constitutes a peer by including other variables? In this piece, we will explore these questions, beginning with how IPEDS establishes institutional peer groups to identify potential customer profiles.
Goals
Understanding peers can be more than aiding leaders in identifying similar institutions. For example, it can also help us see which technology is closely related to different institutions and allow us to ask why a specific institutional peer group selects a given technology. Therefore, we sought to achieve three goals in our revisiting the definitions of peer groups:
- Predictability: Going beyond the distribution of products across institutions to gain insight into whether a substantial and predictable relationship exists between a specific peer group and a technology.
- Interpretability: Providing information that would put the implementation of a specific technology at a given institution in context instead of simply identifying the relationship by sector, size, etc.
- Extensibility: Setting the foundation for future investigation into the relationship between technology and student outcomes (graduation rates, etc.) by additional data (National Clearinghouse, for example).
Finally, we chose these goals to assist different aspects of our audience, such as institutional leaders, vendors, and policy groups.
Methodology
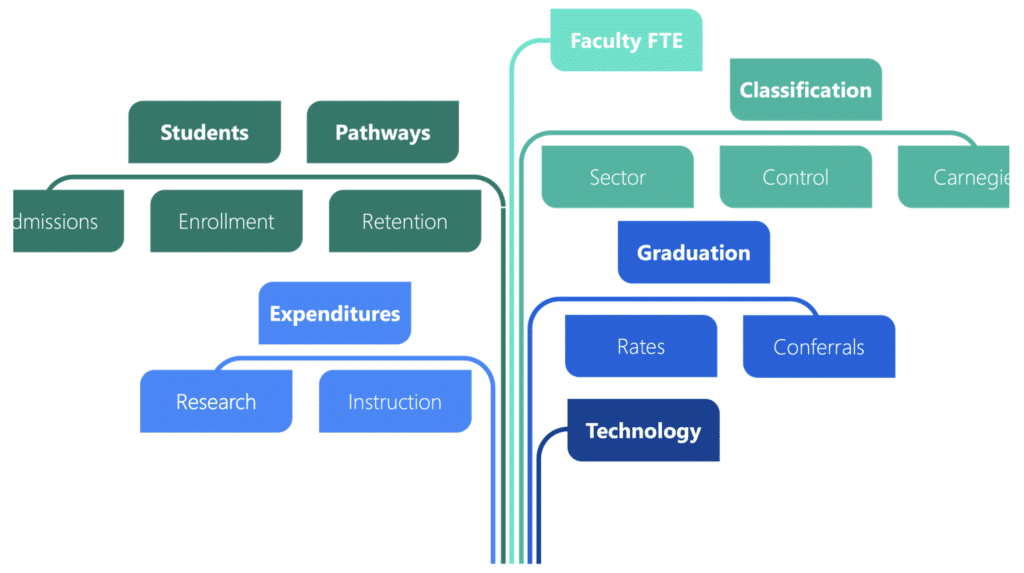
First, we should take a step back and understand our methodology. As part of its work, IPEDS enables institutional leaders to develop data feedback reports, which combine several variables (enrollment size, etc.) to establish institutional peer groups. As institutions widely use this, we began revisiting defining peers with many of the variables IPEDS uses in these reports. Figure 1 shows these variables cover a broad scope of institutional characteristics. We then brought these variables together with our proprietary implementation data, which resulted in a data set of over six thousand institutions in the United States. Finally, we performed cluster analyses on this data to uncover patterns and understand the significant differences between these patterns.
Findings: Five Customer Profiles
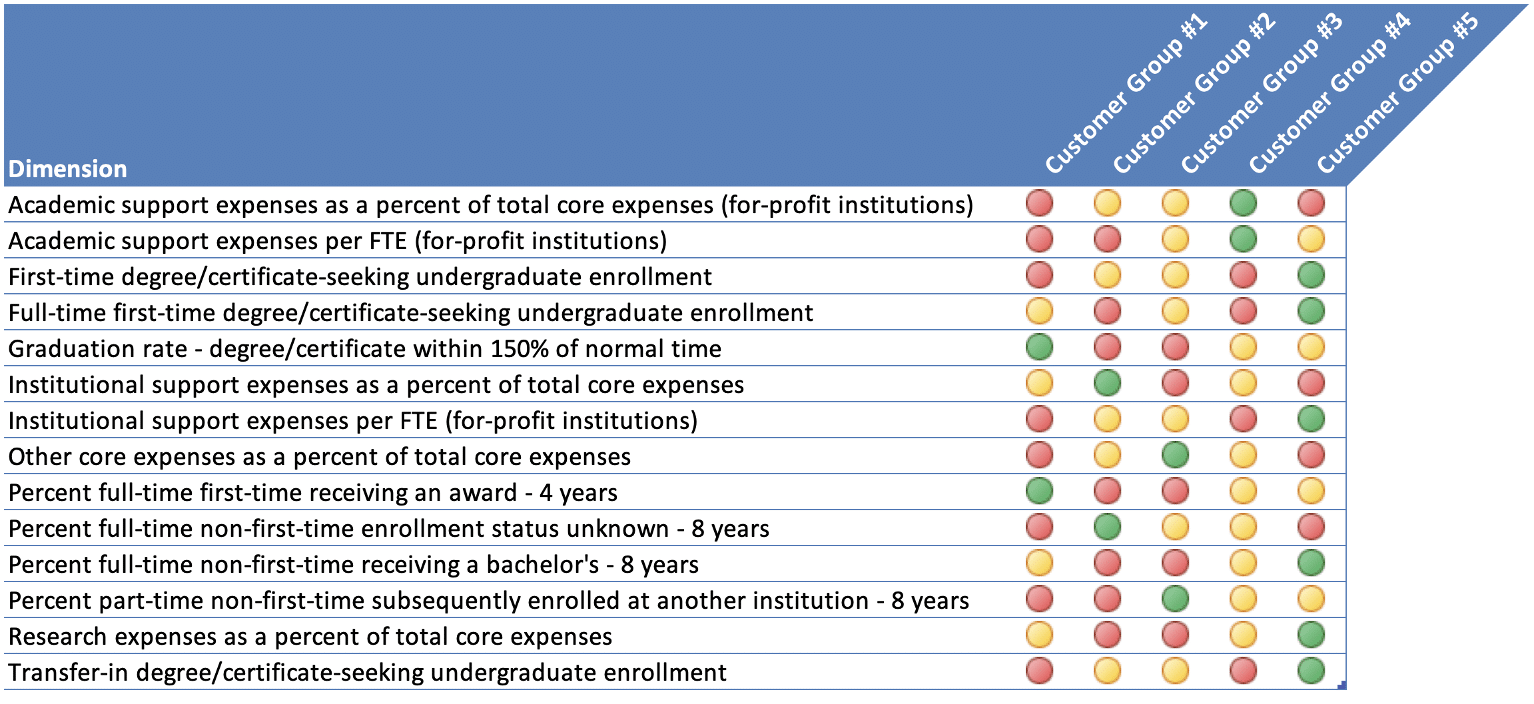
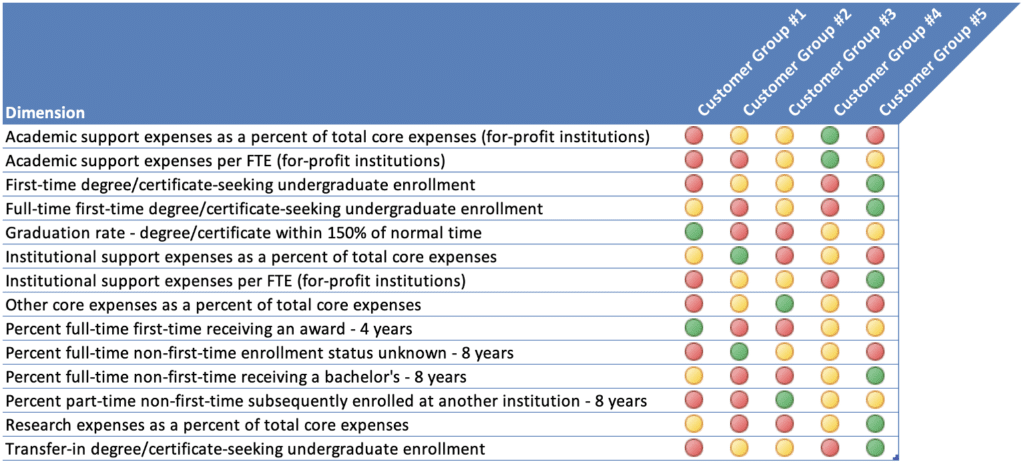
The output of our analysis revealed five customer profiles or peer groups, as shown in Figure 2. While there are many differences between these profiles, we decided to highlight the most significant ones for brevity. Likewise, our analysis identifies two key takeaways:
- Institutional expenses are essential: As the diagram shows, the expenditures devoted to academic, institutional, and research support plays a crucial role in what classifies an institution into a given peer group. For example, group #2 spends a higher percentage of their core expenditures on institutional support, i.e., day-to-day operations. Likewise, group #5 devotes more resources to research as a percentage of their core total expenditures.
- Enrollment is nuanced: While overall enrollment was significant, the different subcategories of enrollment were much more powerful in determining groups. For example, group #5 has higher than average first-time/full-time degree/certificate-seeking undergraduate enrollment. Likewise, transfer-in degree/certificate-seeking undergraduate enrollment-seeking is higher than average in group #5.
What does this all mean? Let us remember our goals: predictability, interpretability, and extensibility. Our approach allows us now to address all three. For example, we can say that while D2L’s Brightspace is not the most implemented solution in any customer group, the likelihood of its implementation is two and a half times higher than in any other customer group. Also, our analysis reveals that Ellucian’s Banner is nearly two times more likely to be implemented by institutions in group #3. This finding allows us to ask whether it is better suited to handle more than average first-time or transfer student populations. Lastly, we can now ask whether there are specific technologies or combinations of technologies that closely relate to institutions with above-average graduation rates within 150% or normal time or receiving a bachelor’s degree in 8 years.
Summary
Understanding peers is valuable, as we can gain insight into patterns of implementations across higher education and perhaps institutional priorities relating to technology. Yet viewing peers by more than size and sector does provide additional insight that viewing peers by these characteristics alone obfuscates, allowing us to predict whether certain institutions will have implemented specific products, ask whether certain technologies fit different student populations better, and begin to explore the relationships between student outcomes and implemented technologies.
In future research, we will continue refining this analysis. For example, might other factors give greater insight into the customer groups and their implemented technologies? Likewise, how might these groups look over time, i.e., do technologies move across groups over ten years?
We would love to hear your feedback. Please feel free to reach out if you like.