Key Takeaways:
- Critical Role of IT in Education IT staffing is vital across both higher education and K-12 institutions, supporting everything from advanced research initiatives in universities to device management in school districts. The growing reliance on technology highlights the essential role IT teams play in maintaining the operational backbone of education.
- Staffing Discrepancies and Influencing Factors Staffing levels vary widely between institutions due to factors such as research intensiveness, specialized facilities, and departmental needs. Data from central IT teams suggests this is not a direct comparison, as personnel in non-central IT roles may not be fully accounted for, potentially underreporting actual staffing levels.
- Purpose and Limitations of Early Data The preliminary analysis aims to address a recurring industry question: “How does our IT staffing compare to peers?” While the data provides valuable insights, it should be interpreted cautiously due to inherent limitations and differences between institutions. This early release reflects the value of client-driven feedback while ongoing efforts continue to expand the dataset.
In today’s educational landscape, the role of IT staff has never been more critical. From supporting research-intensive universities to managing devices in K-12 classrooms, IT teams ensure the technology backbone of institutions runs smoothly. But how do staffing levels differ within higher education or school districts? An IT staffing comparison reveals the factors driving these variations and what institutions can learn from evaluating their IT resources.
To answer these questions, we’ve analyzed data from hundreds of organizations (750 institutions and 350 school districts), offering insights into the evolving demands of IT staffing across the education sector. We gathered data directly from central IT websites—not self-reported data. Are we missing IT personnel working in other departments? Yes. Does this likely underreport the total IT staff? Probably. But we believe this is still a valuable data point worth exploring. That being said, we suggest being very cautious with the information presented in this blog post. As you all know, this is not a strait apples to apples comparison. Many different factors can affect the number of IT staff including research intensiveness, specific institutional facilities, faculties or labs, etc.
So Why Post This Data on IT Staffing Comparison?
At ListEdTech, client feedback drives our work, helping us identify the questions and challenges that matter most to institutions and to industry. One recurring question we hear is, “How does our IT staffing compare to peers?” To address this, we’ve analyzed the data we have so far. Instead of waiting to compile a full dataset and build a dashboard for our portal, we’re sharing these early findings now, knowing they can already provide valuable insights while we continue gathering more information.
Research Universities vs K-12: IT Staffing Comparison Insights
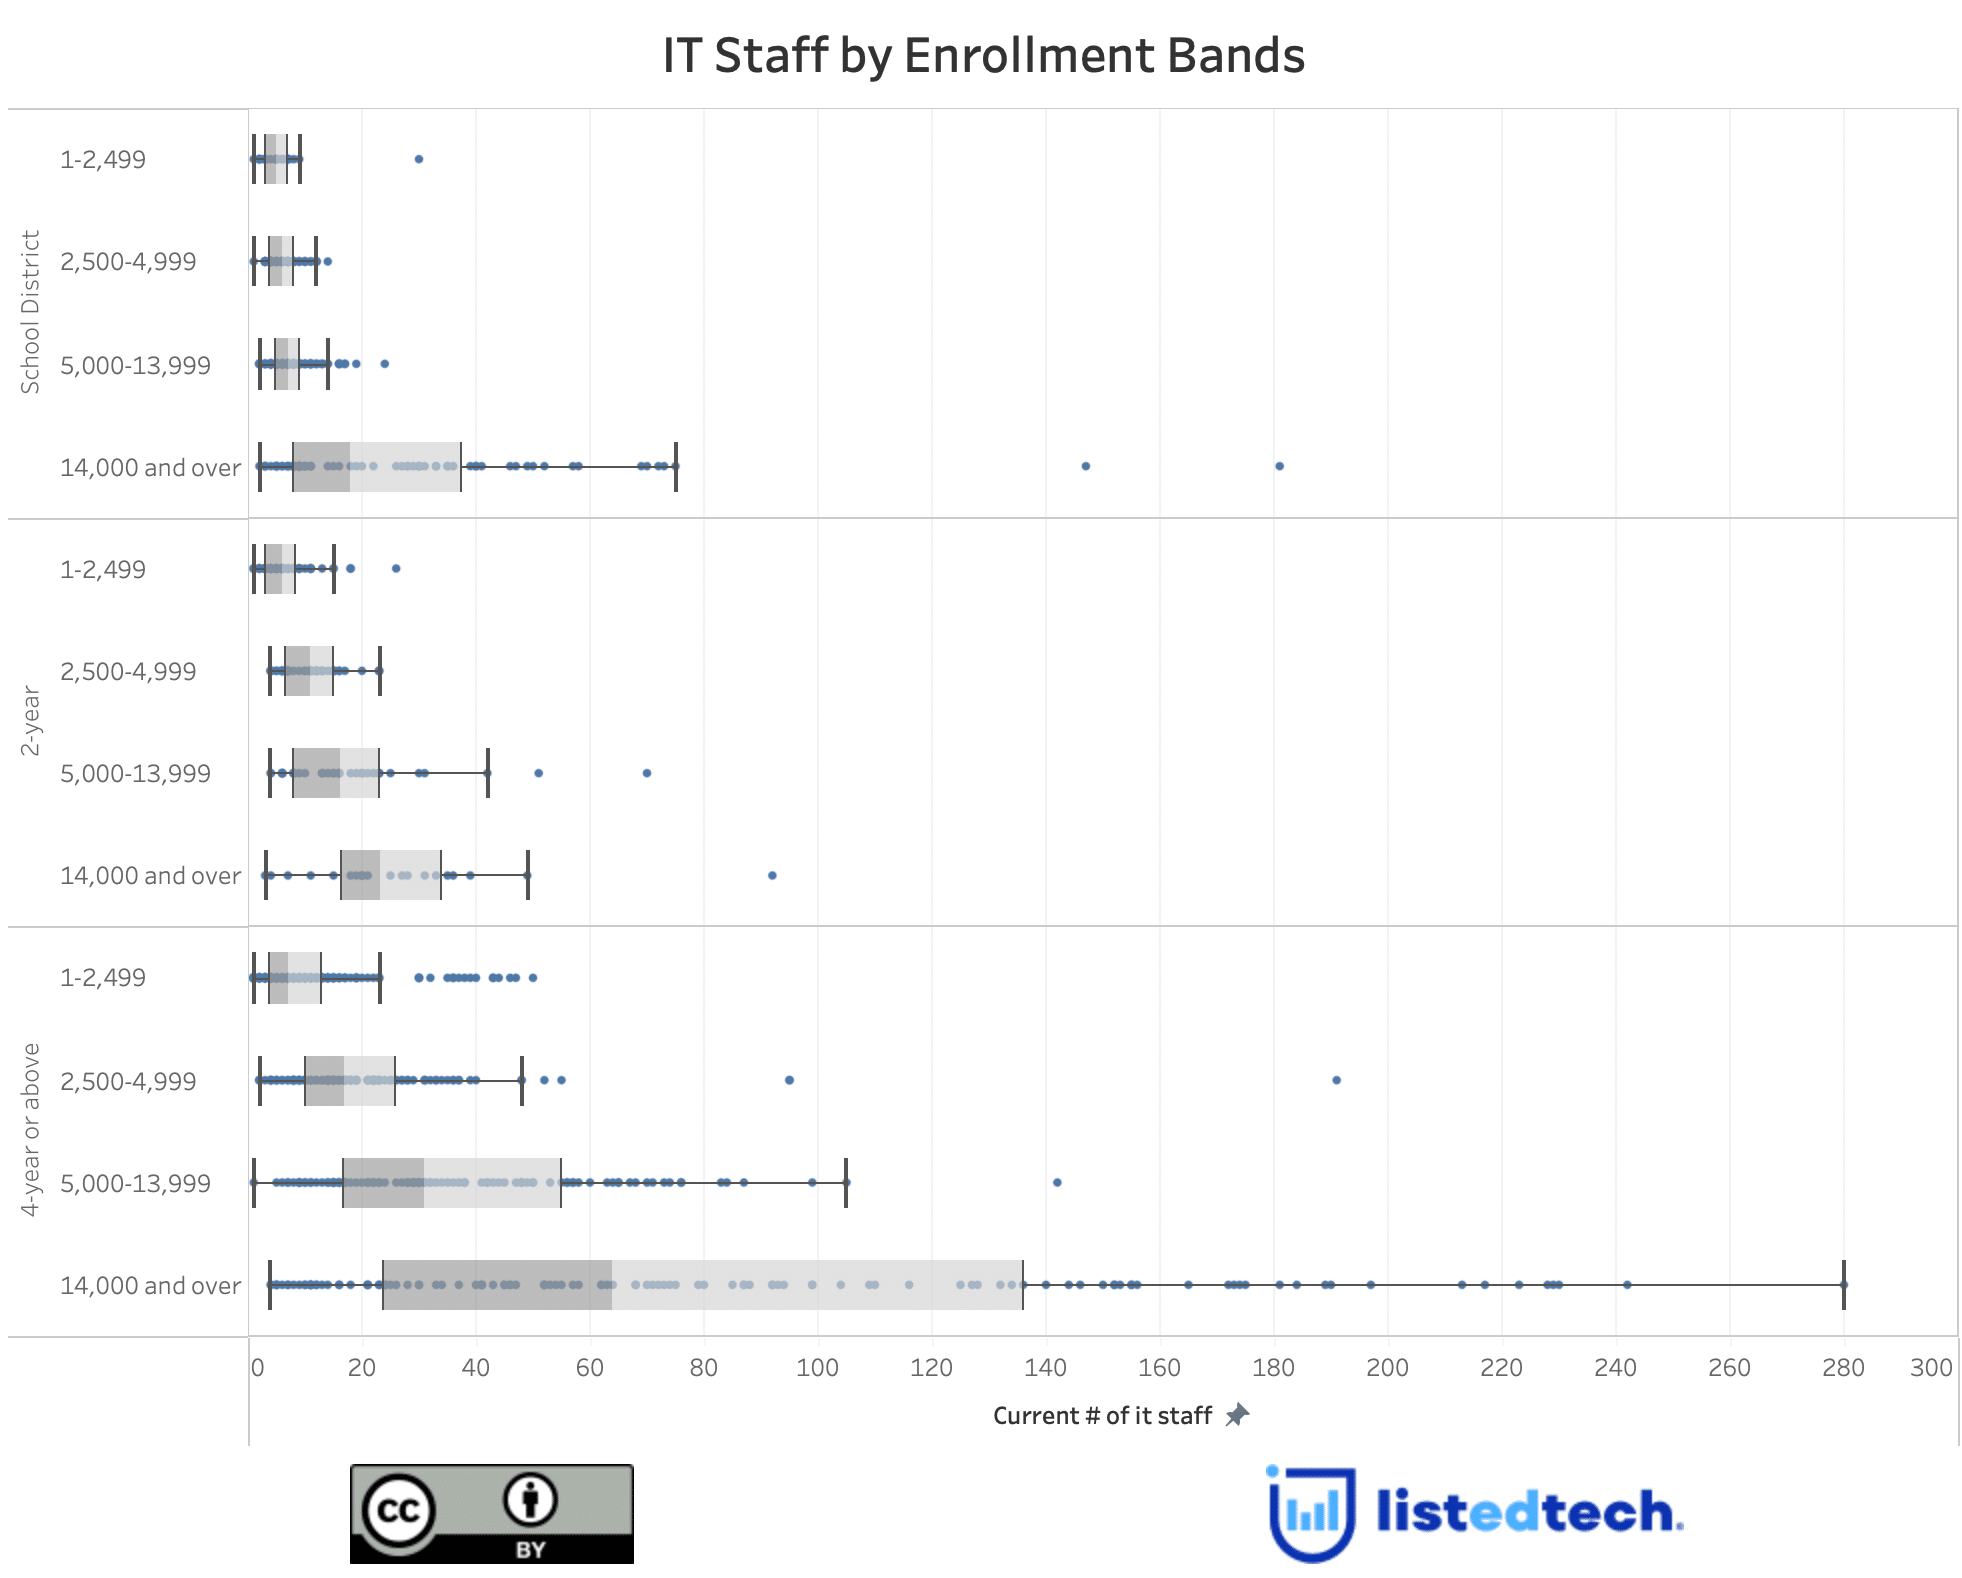
When comparing IT staffing levels, research universities consistently outpace other institutions—and for good reason. These institutions operate in highly complex environments that require significant technological support to meet their unique demands. Here are a few key factors that drive their increased IT staffing levels:
- Research Needs a Lot of Support: Big research projects often involve massive amounts of data, advanced software, and complex systems—so they need IT pros to keep everything running smoothly.
- Lots of Specialized Programs: Fields like engineering, medicine, and computer science rely on cutting-edge tech and tools, which means more IT support for students and faculty.
- Bigger Campuses, Bigger Needs: Larger student bodies and sprawling campuses come with more systems, devices, and people to support.
- Complicated Systems: Universities juggle a ton of enterprise tools—managing HR, finance, research grants, alumni relations, and more—all of which need IT oversight.
- More Funding to Work With: Research universities often have larger budgets, so they can hire more IT staff and invest in better infrastructure.
K-12 School Districts vs Higher Ed
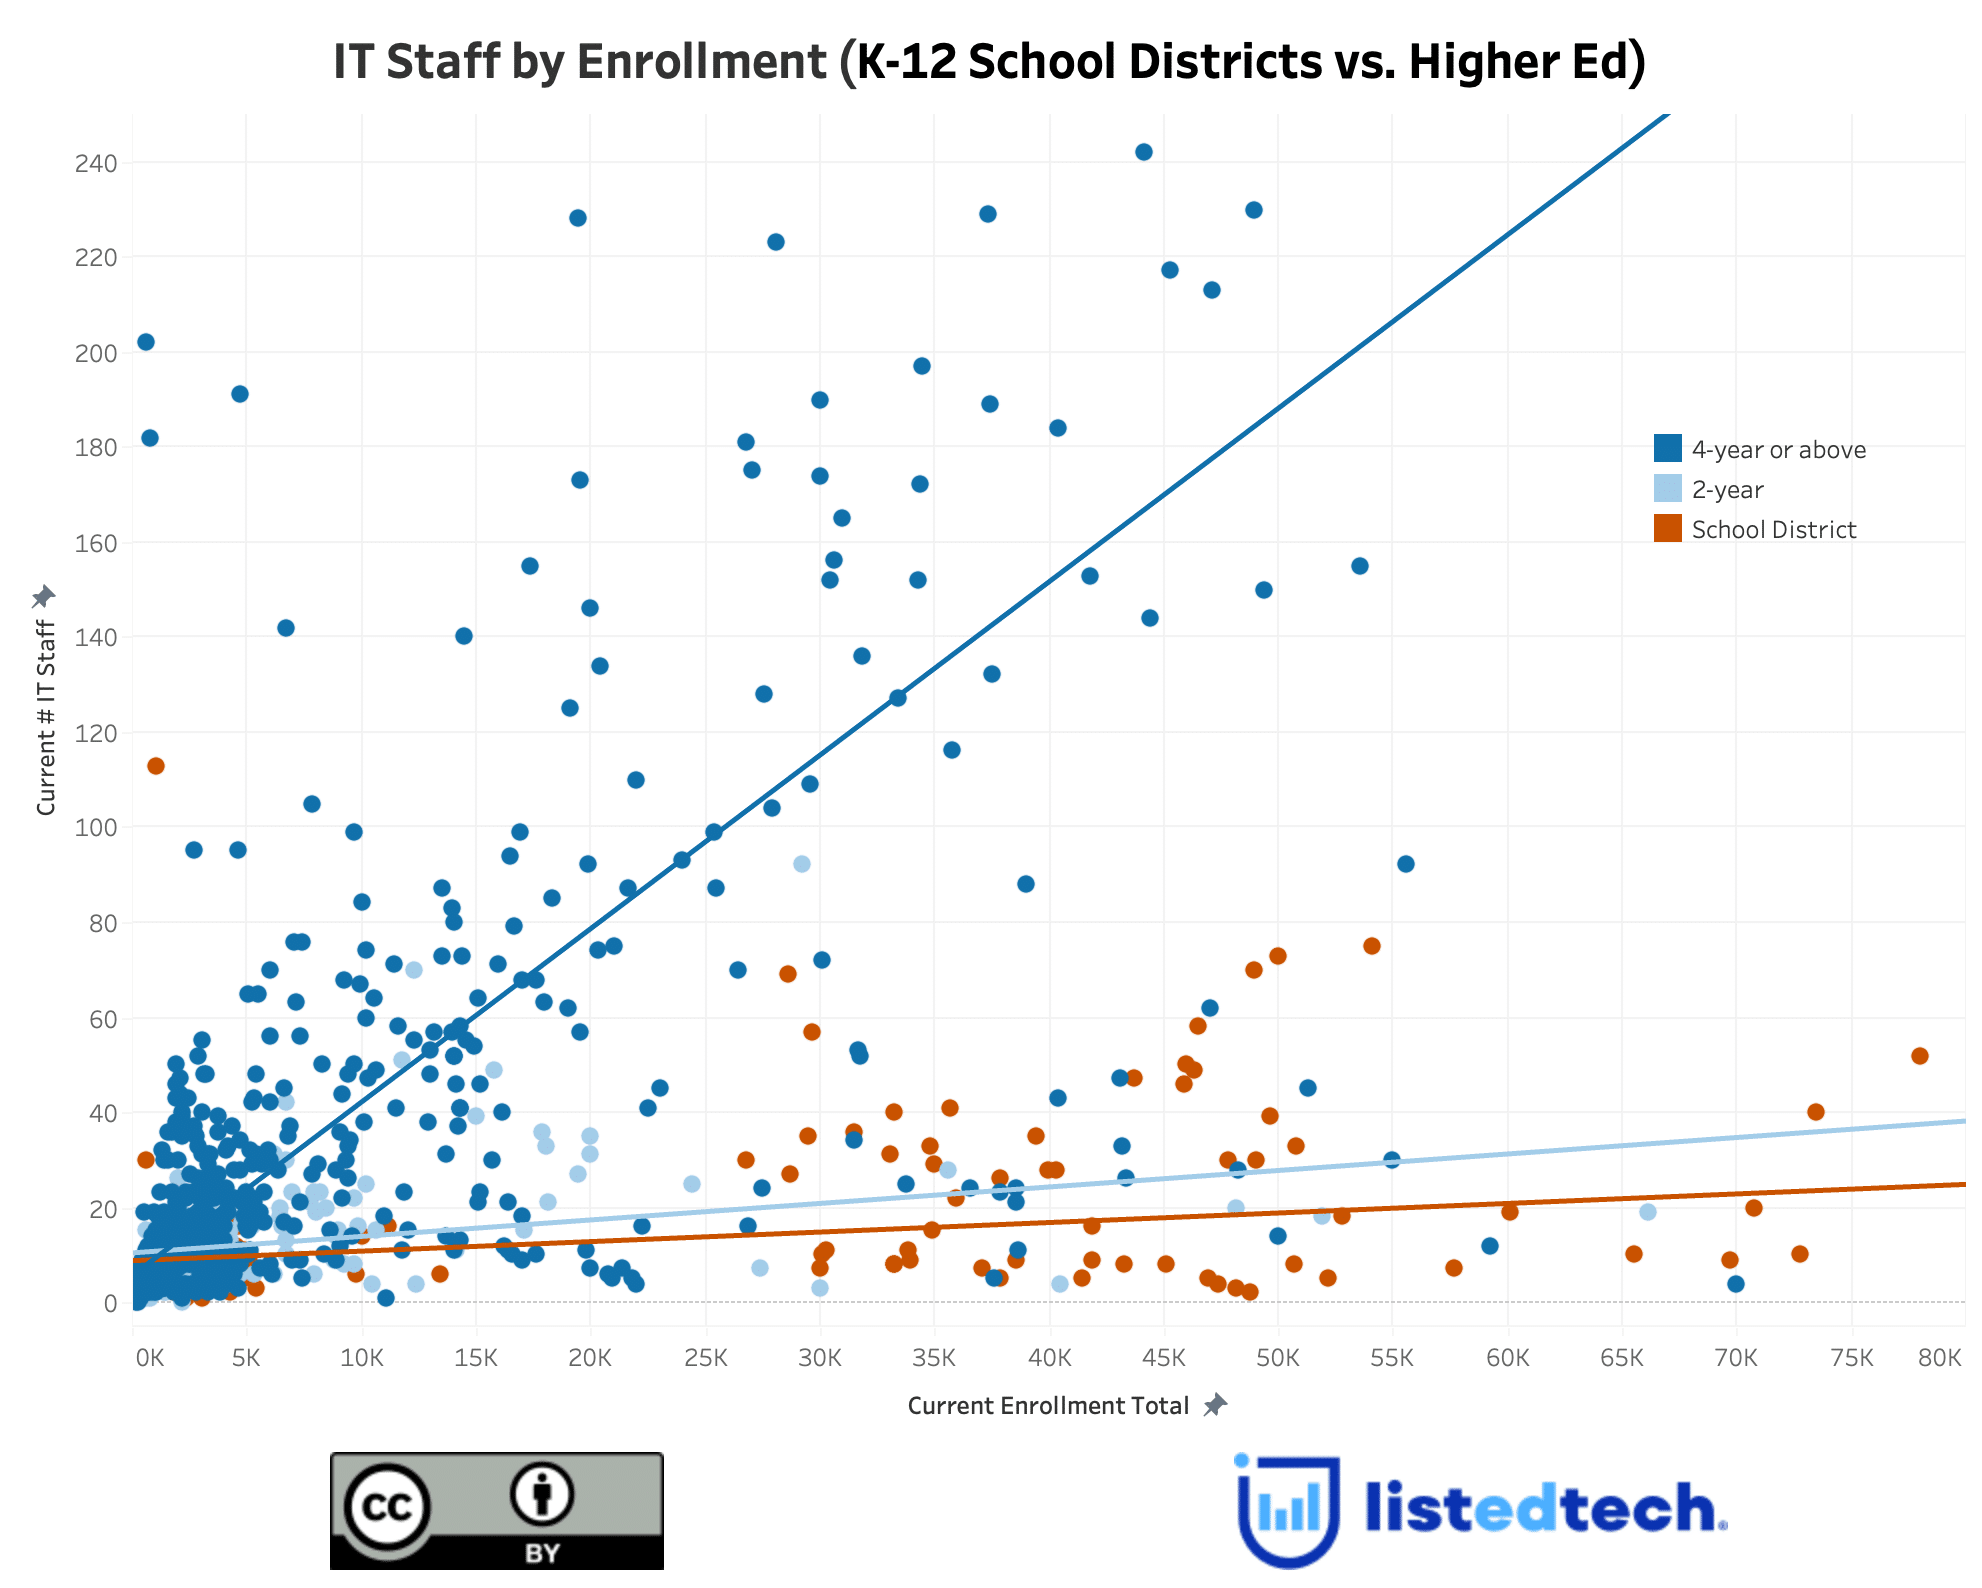
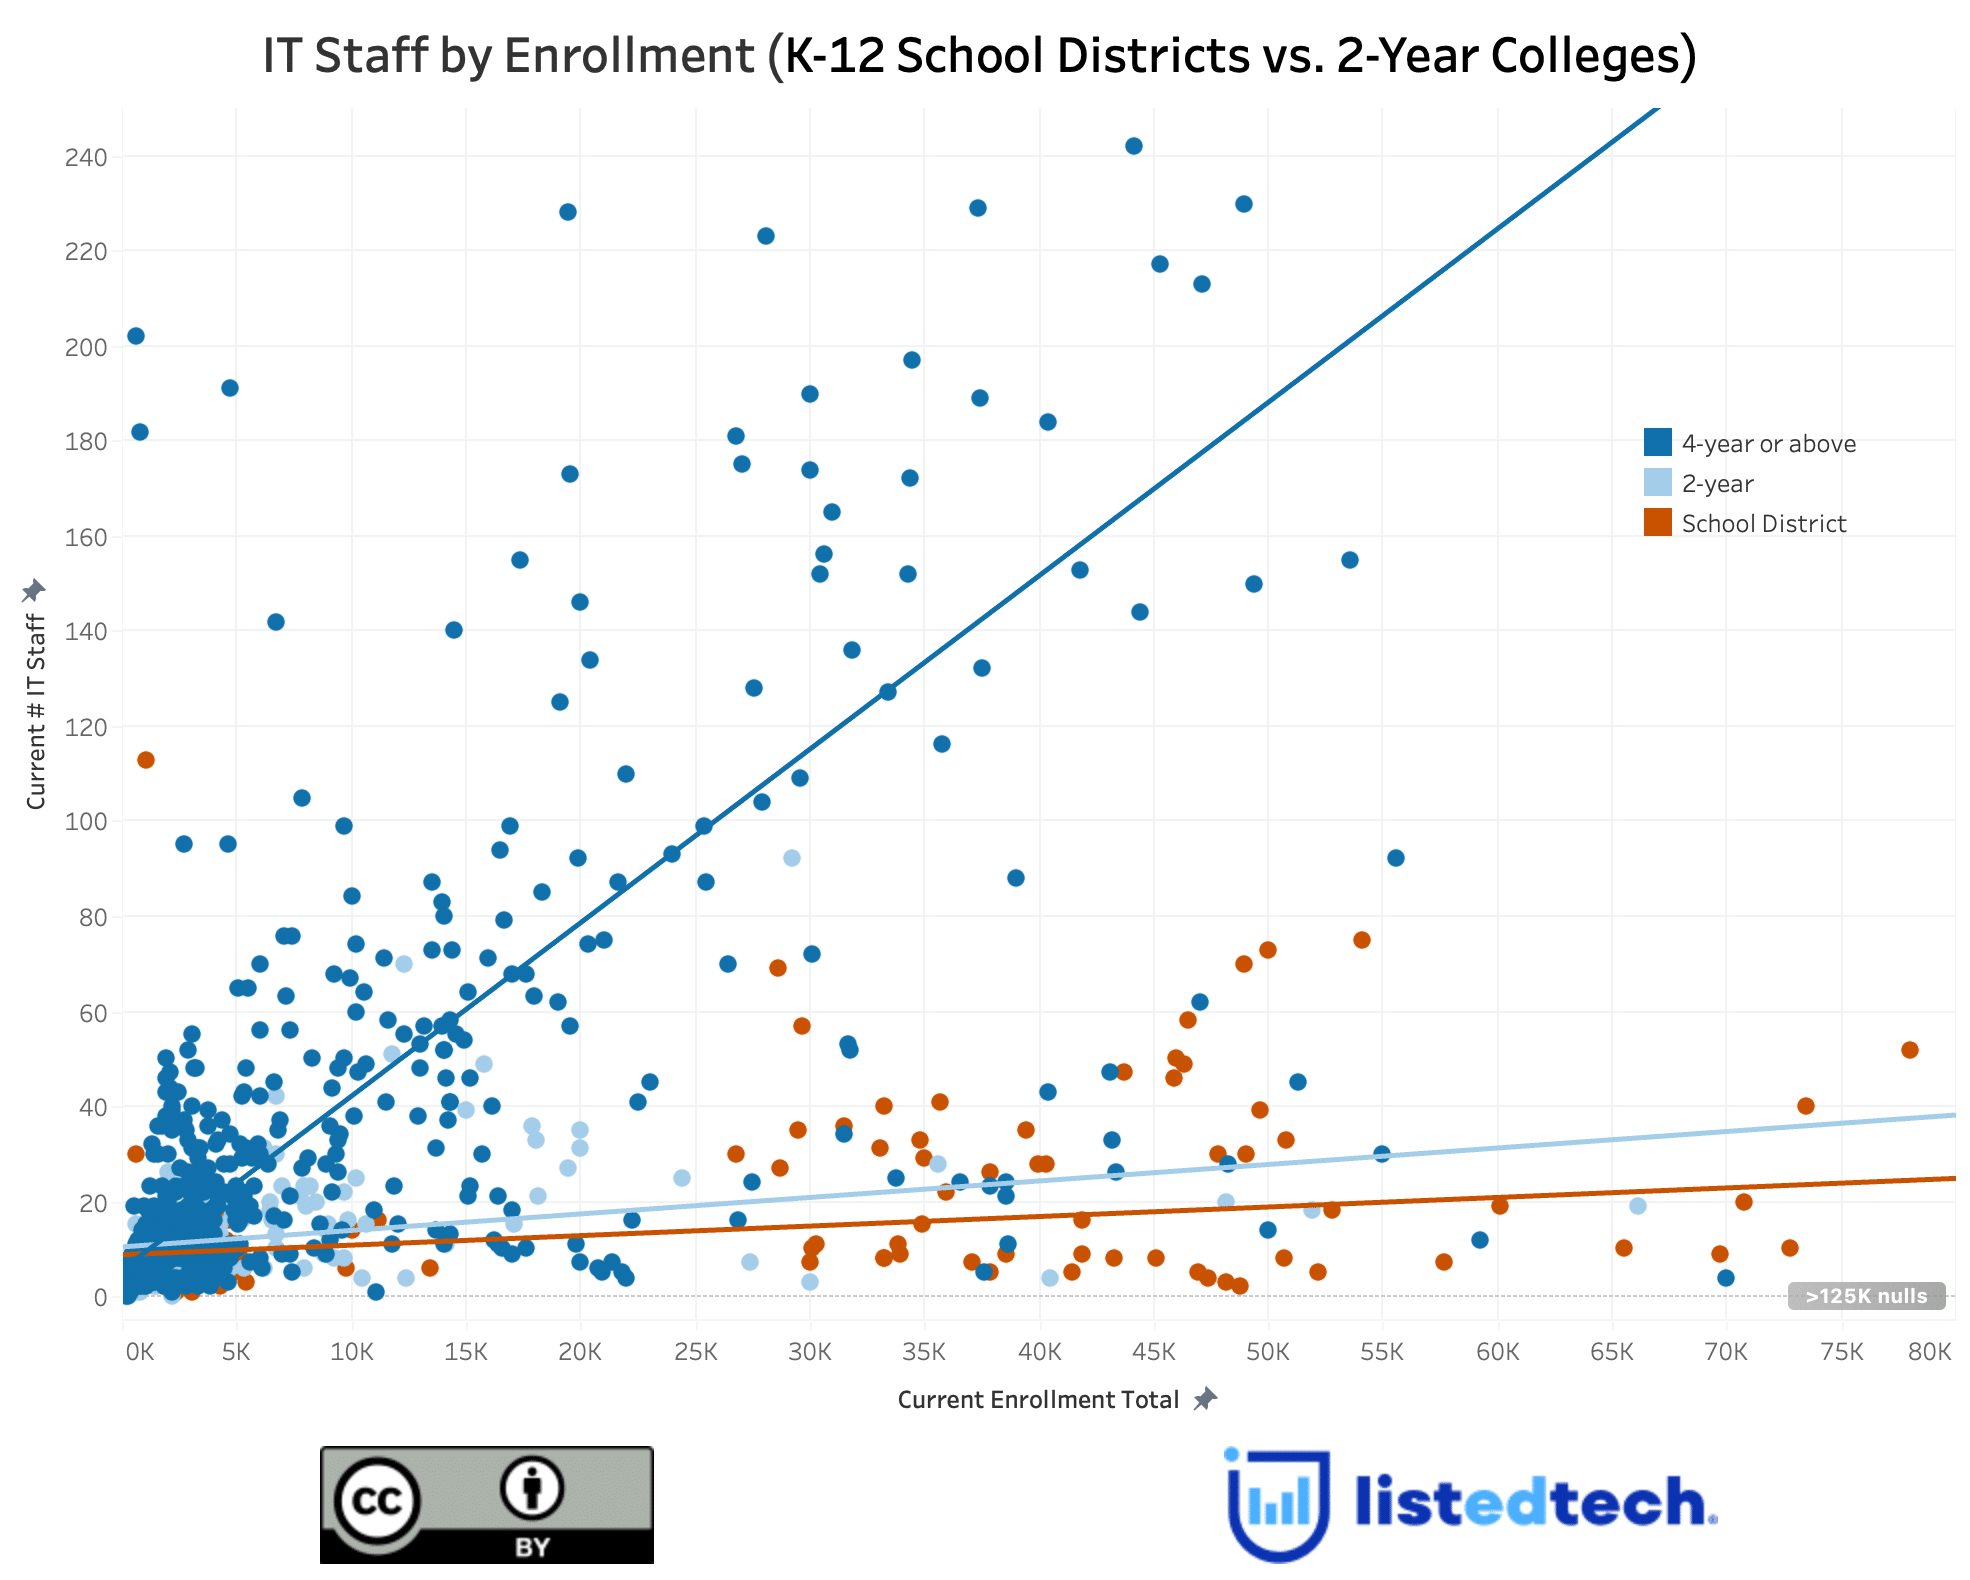
What stood out in our analysis is the similarity between K-12 districts and 2-year colleges when it comes to IT staffing. Despite operating in different educational contexts, their IT teams share a common focus: providing an efficient, reliable backbone to ensure learning happens seamlessly.
Key reasons for this similarity:
- Supporting Student Learning:
- Learning Management Systems (LMS): Platforms like Google Classroom or Canvas are foundational tools.
- Device Management: Both sectors manage thousands of devices (laptops, tablets, Chromebooks).
- Scale and Decentralization:
- Large K-12 districts and small colleges serve comparable populations, requiring similar help desk, training, and support staffing levels.
- Budget Constraints:
- Both sectors face funding challenges, often requiring IT staff to juggle multiple roles (networking, user support, system management).
- Growing Demand for EdTech:
- Platforms for video conferencing, blended learning, and digital assessments have become critical in both environments.
The Impact of the Cloud
One observation is the growing impact of cloud adoption on IT systems, especially for smaller institutions. By moving many core systems off-site, institutions have significantly reduced the need for on-premise infrastructure maintenance. However, the effects of this shift vary:
- 2-Year Colleges and K-12 Districts: These institutions seem to benefit the most, leveraging the cloud to streamline operations and manage resources more efficiently.
- Research Institutions: In contrast, research universities continue to develop and maintain homegrown systems to meet the unique demands of their research initiatives, which drives higher IT staffing requirements.
| IT Staff per 1000 Students | |||
| Enrollment | K-12 | 2-Year Colleges | 4-Year or Above Institutions |
| 1,000 | 5 | 5 | 9 |
| 3,000 | 2.3 | 3.3 | 6.7 |
| 10,000 | 1 | 1.5 | 4.2 |
| 20,000 | 0.6 | 0.9 | 4 |
| 50,000 | 0.4 | 0.6 | 3.8 |
| Note: This is preliminary data. | |||
Conclusion
In this IT staffing comparison in education, we’ve highlighted the distinct differences across various types of educational institutions. From research universities to K-12 districts and 2-year colleges, each institution faces unique challenges and demands when it comes to IT support. Understanding these differences is crucial for institutions looking to evaluate and compare their IT staffing levels as the landscape of IT in education continues to evolve. Do these patterns align with what you’re experiencing at your institution? We’d love to hear your thoughts and feedback as we continue to explore and refine our data.