As mentioned in a previous post, (https://www.listedtech.com/blog/k12-student-information-systems), we are actively getting data for K-12 school districts. We currently have over 5,000 school districts that represent over 50,000,000 registered students in Canada and the USA.
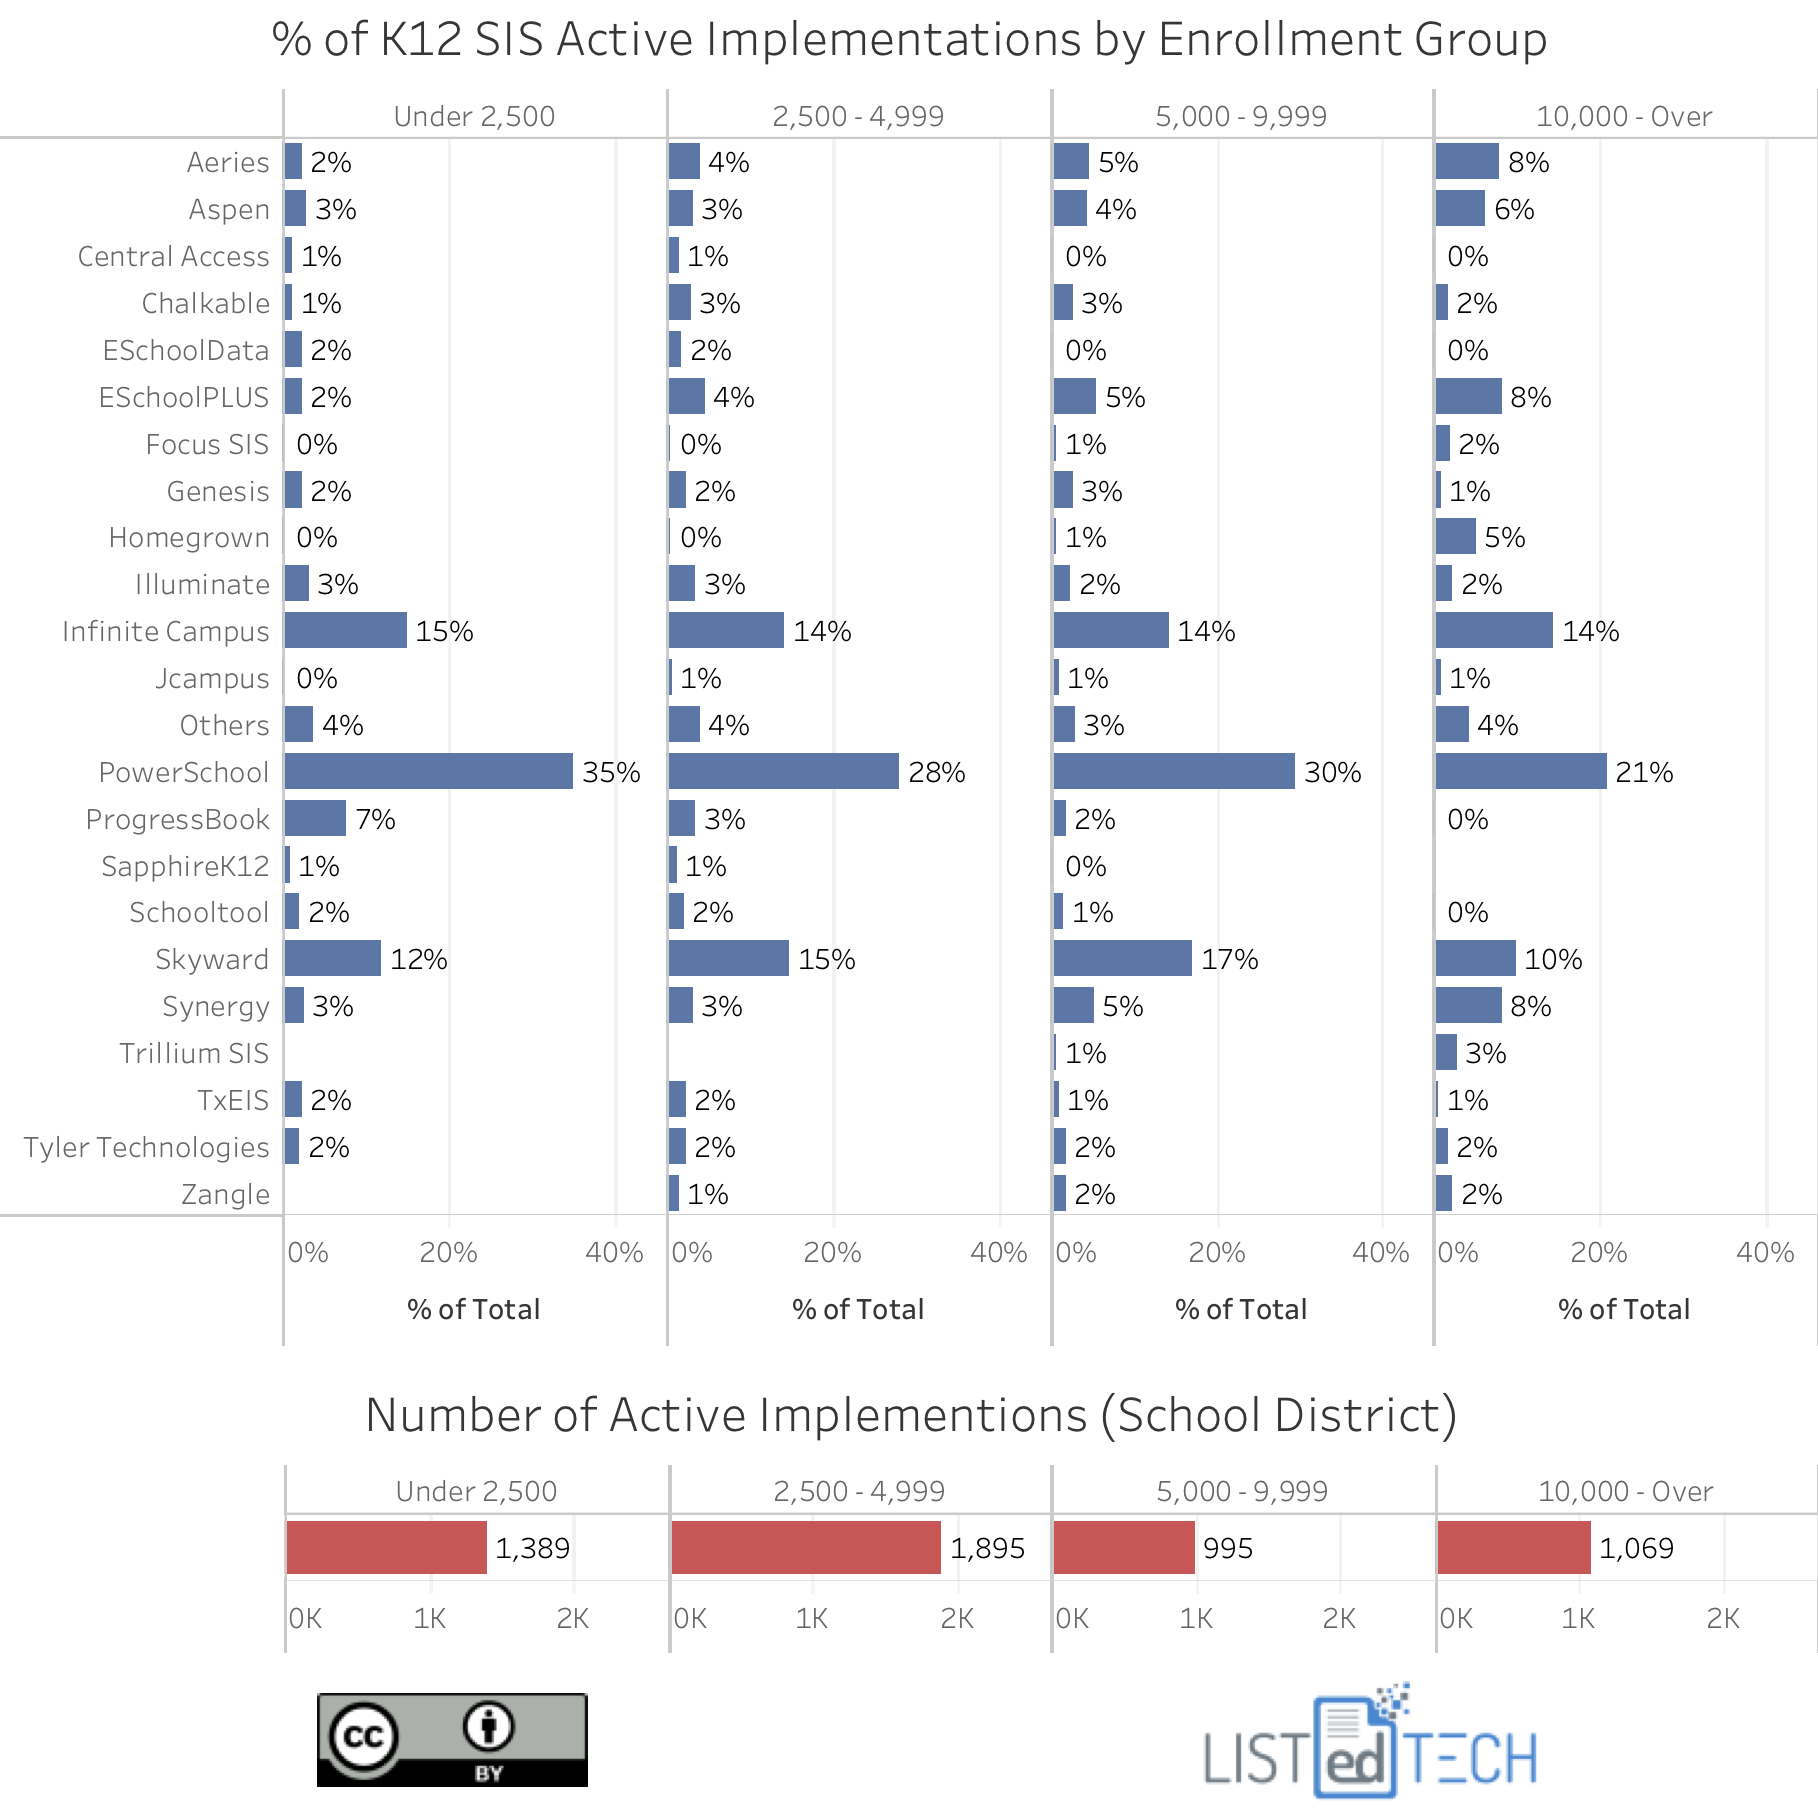
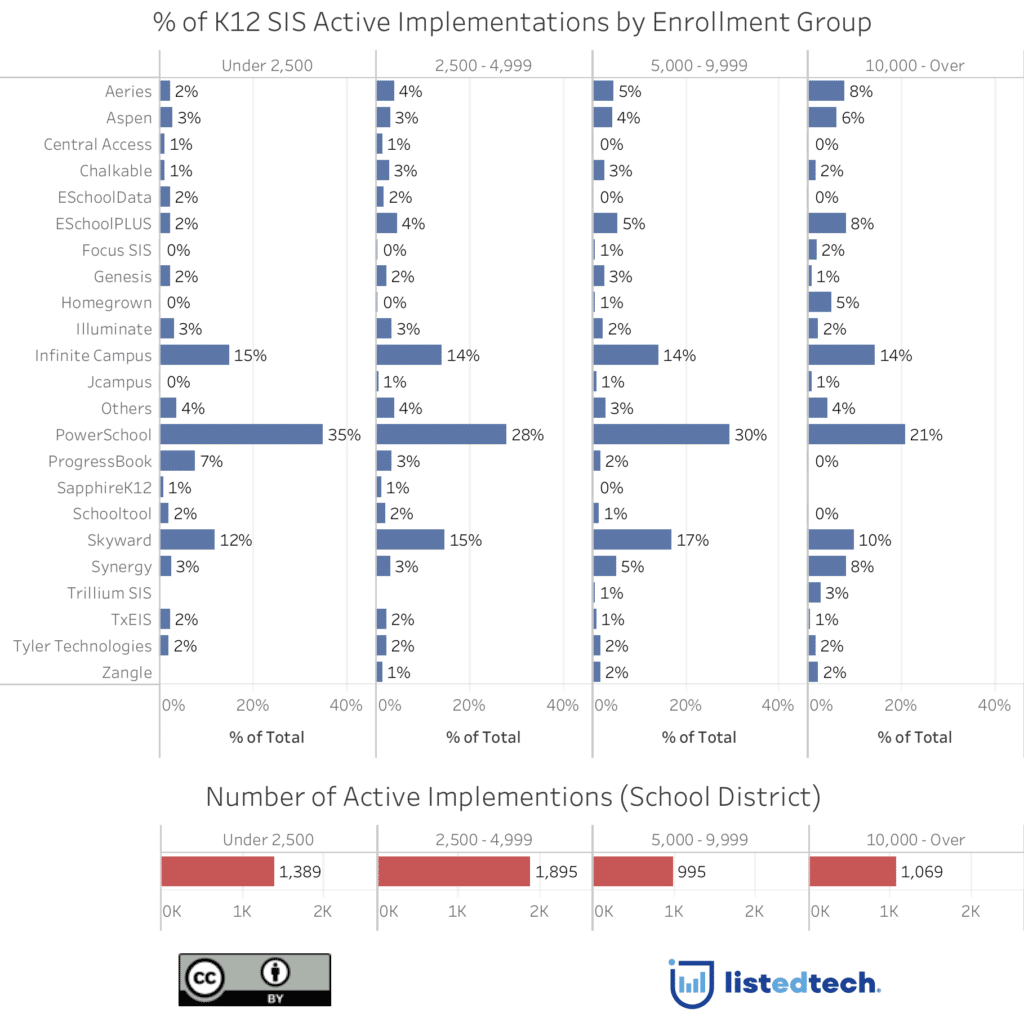
Even if we are still collecting the data, we can now start to look at market shares. We generated the graph below by creating enrolment groups for the school districts, not individual schools.

To be able to read this graph properly, you have to consider that the sum of percentages is made for one enrollment group (column) and not for one SIS (row). Taking Aeries as an example, this SIS system has a 2% market share in the smaller school boards (under 2,500) but has an 8% market share in the bigger (10,000 and over).
More in depth…
We notice that the market shares for a product are somewhat similar across the four enrollment groups. Infinite Campus has around 15 % of market shares, Tyler Technologies has 2% across the board, Illuminate has 2-3 %, etc.
In some cases however, the ‘10,000 and over’ group is slightly different: While PowerSchool, Infinite Campus and Skyward dominate the smaller school boards, their market shares drop to the benefit of eSchoolPlus, Synergy and others in larger school boards.
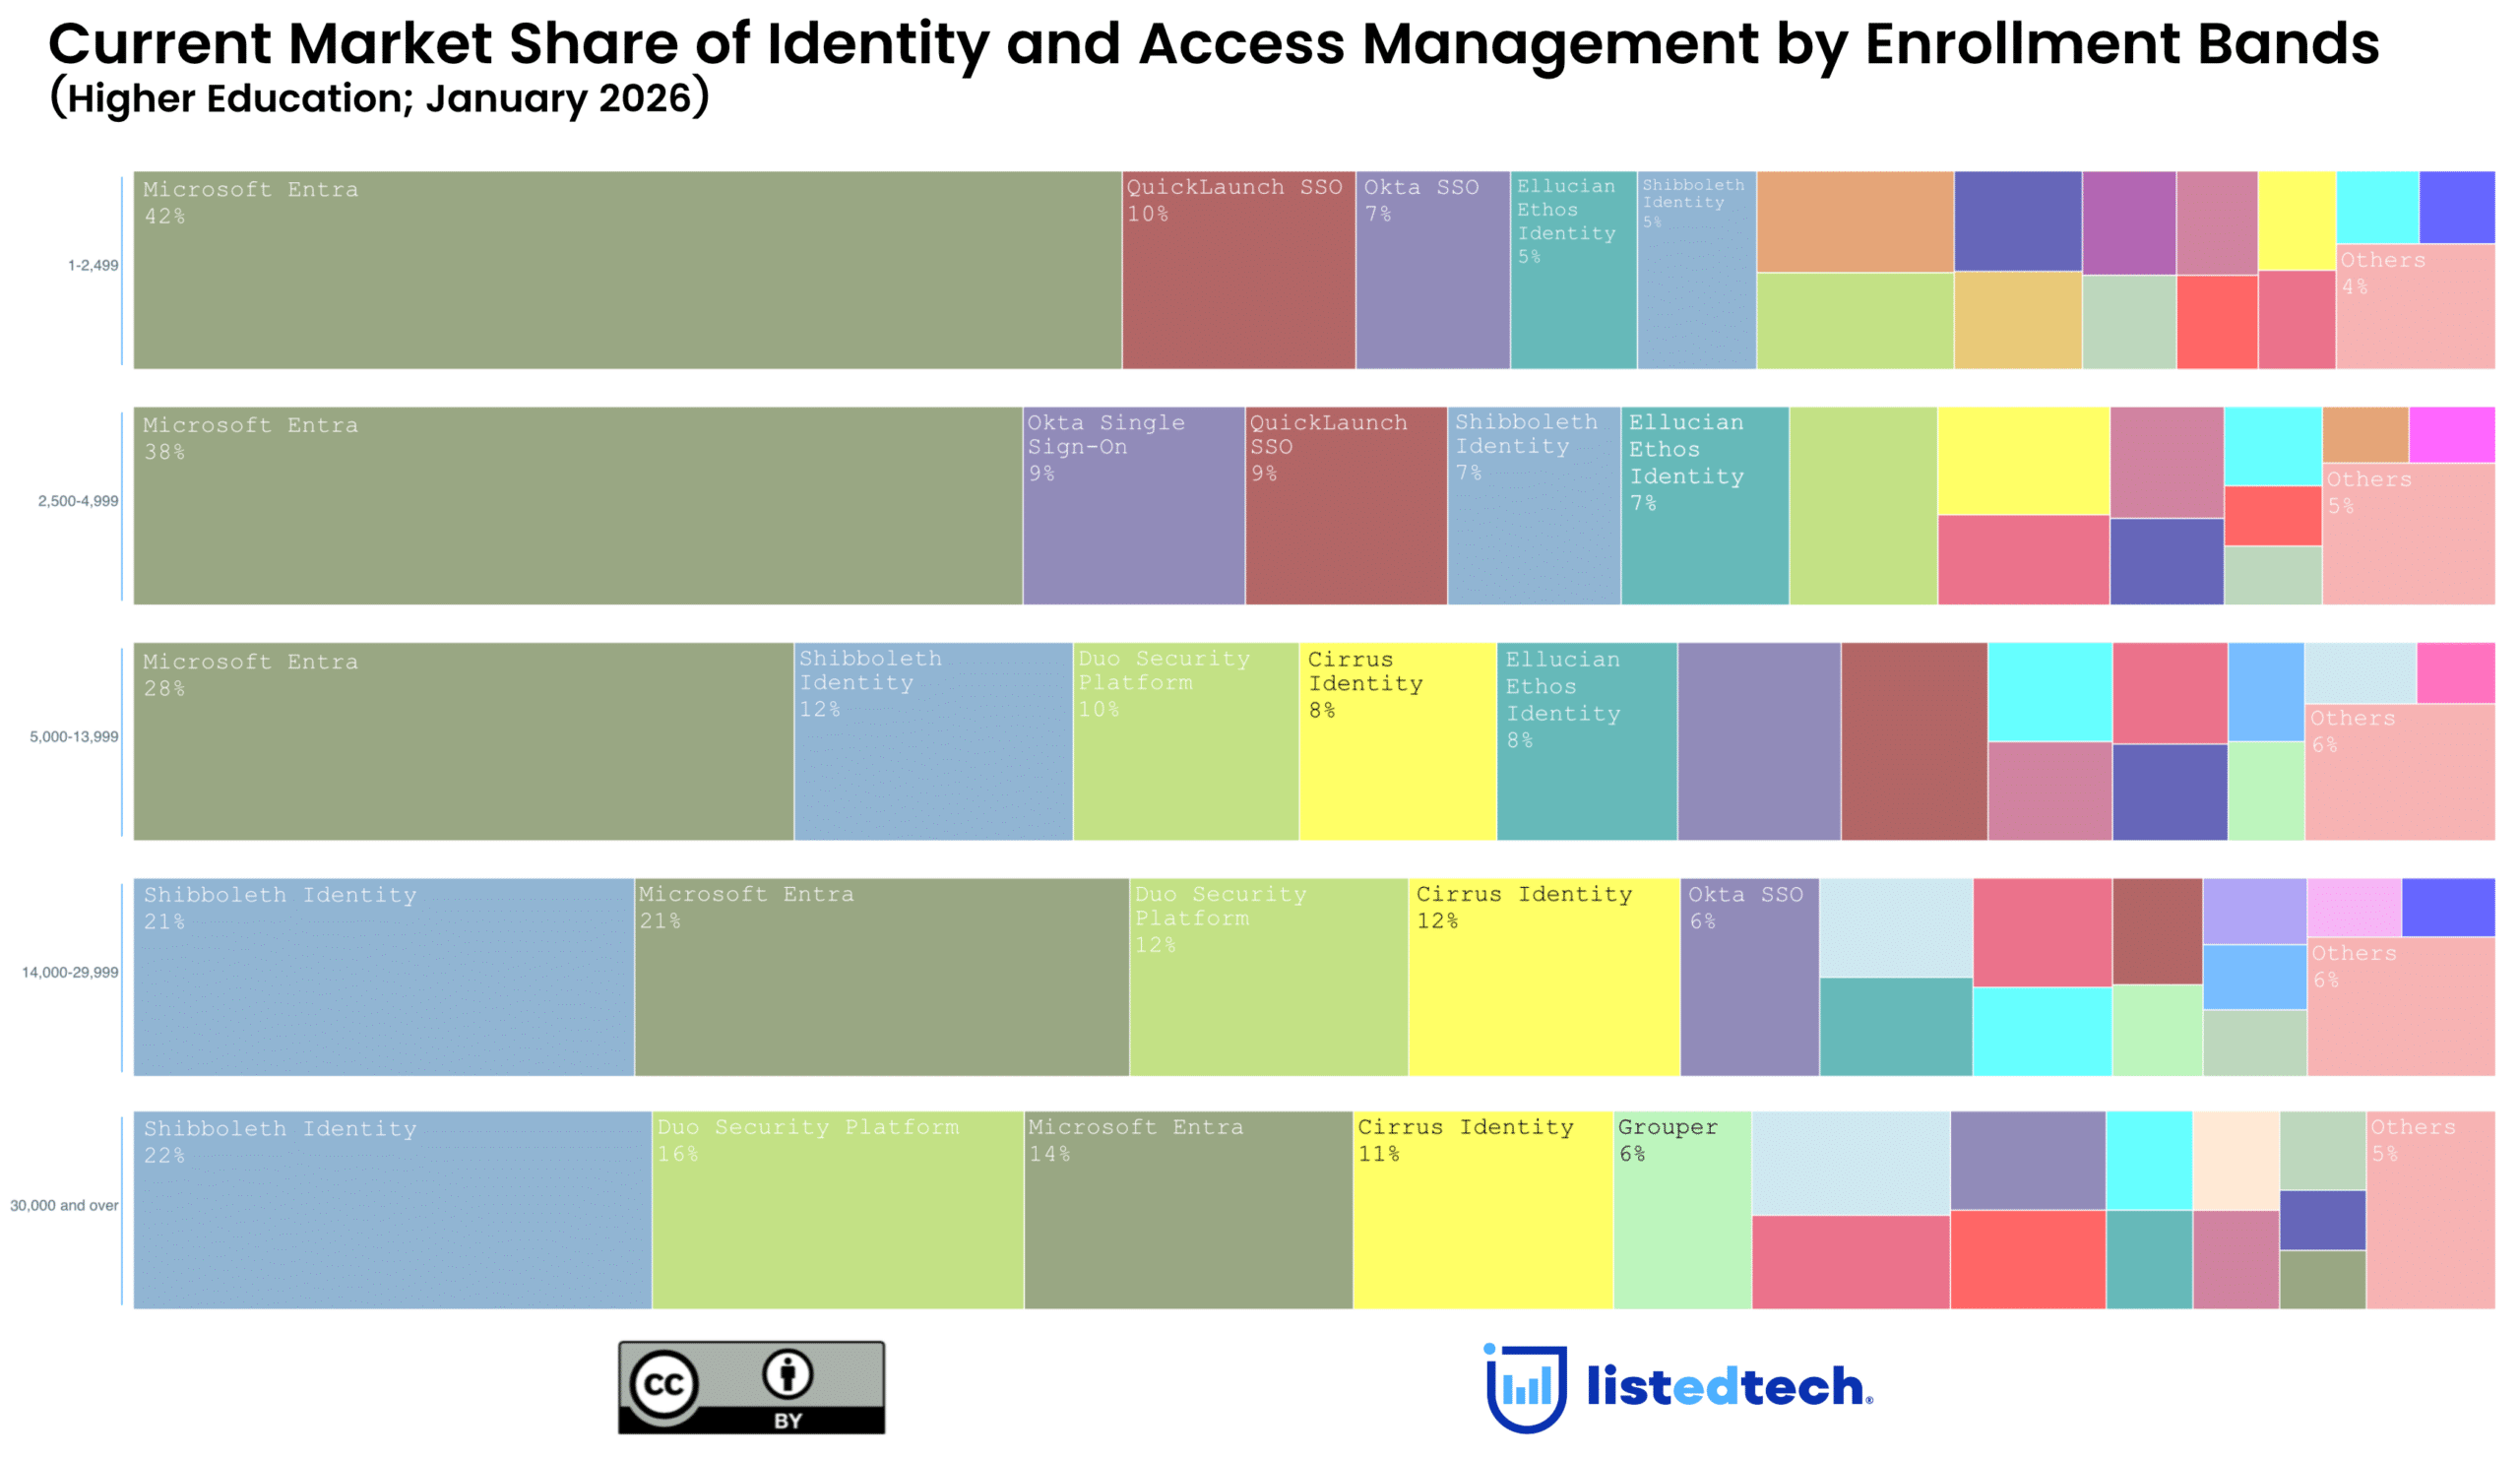
We also note a difference in active companies in the K-12 group compared to the HigherEd institutions. Only a few products share both sectors: while PowerSchool is very strong in K-12, it is almost nonexistent in the HigherEd market. See https://www.listedtech.com/blog/student-informations-systems-by-degree-type for more HigherEd data.


